
March3,2022
DWR news release
March3,2022
DWR news release
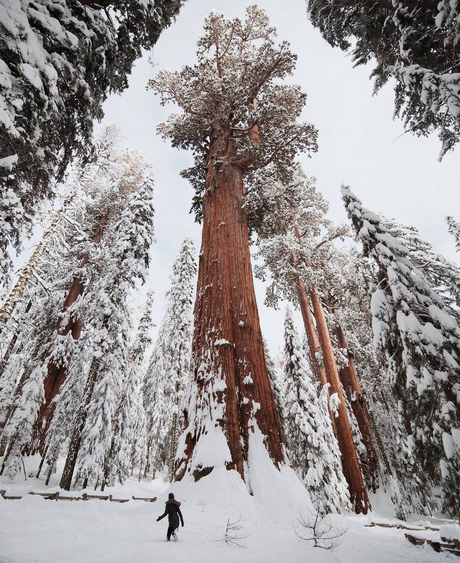 SACRAMENTO, Calif. – The Department of Water Resources (DWR) today conducted the third snow survey of the season at Phillips Station. The manual survey recorded 116.5 inches of snow depth and a snow water equivalent of 41.5 inches, which is 177 percent of average for this location on March 3. The snow water equivalent measures the amount of water contained in the snowpack and is a key component of DWR’s water supply forecast. DWR’s electronic readings from 130 snow sensors placed throughout the state indicate the statewide snowpack’s snow water equivalent is 44.7 inches, or 190 percent of average for this date.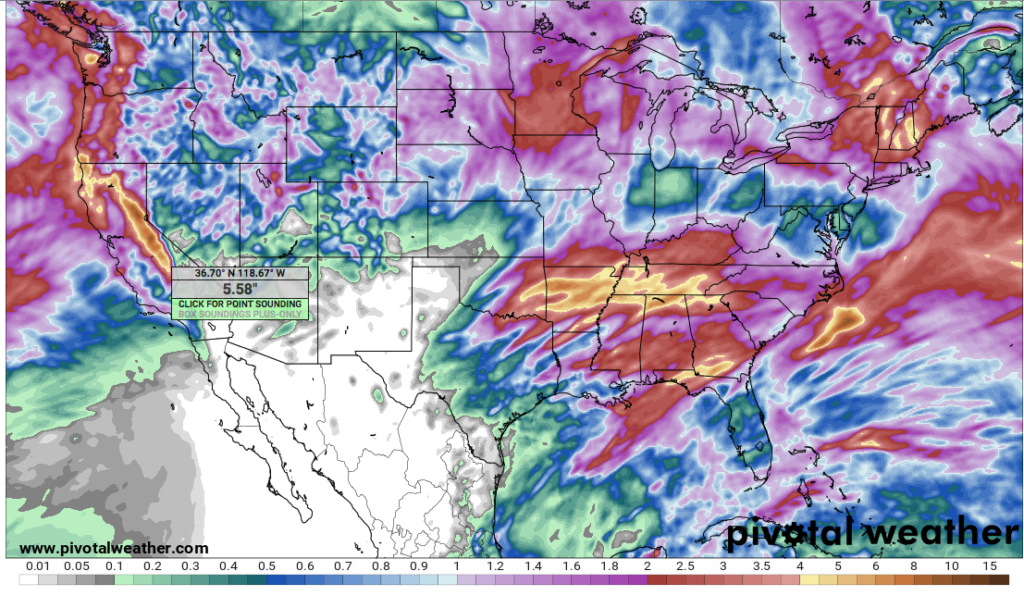
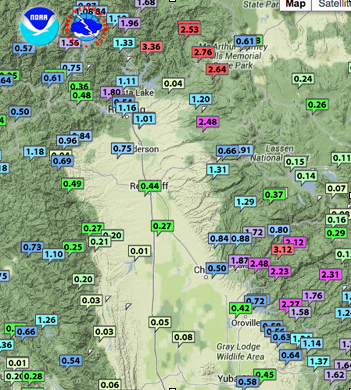
Summer storm this week drops 2 to 3 plus inches of rain around Shasta Lake. Left : 48 hr rainfall total in north San Joaquin Valley showing substantial precipitation in the Shasta and Oroville areas where the state’s largest reservoirs are located. Forecasters say the unusual storm could be followed by (gulp) record heat. Other map is a 84 hour projection of rain total that could reach 4 inches (red) before its done.

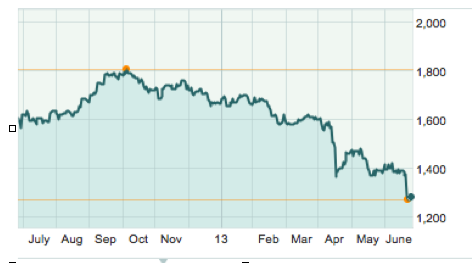
Those of us that took the advice of financial advisors to buy gold last fall because of gloomy projections about the economy have been rewarded by gold dropping in value by near one third since then. Now that is something to be gloomy about.
Tulare County Projected To Be 68% Latino by 2060
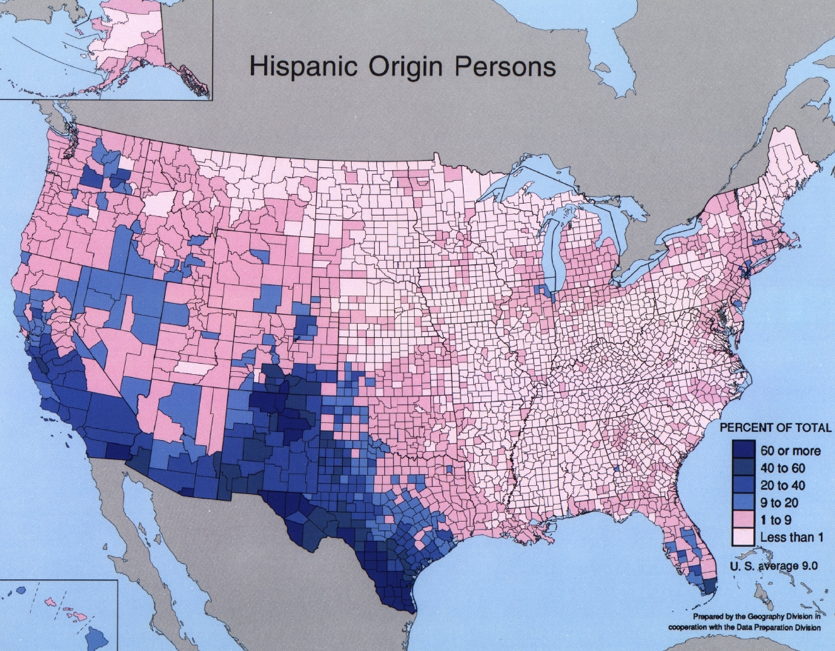 New projections by the California Department of Finance say that 2014 will be the year California will become 50% Hispanic. A number of Valley counties are there already. The growth in the Hispanic population in the south Valley including Fresno,Tulare and Kern counties – is the main reason this region will see some of the fastest growth in the state over the next 50 years.
The population projections announced last week say Fresno County will grow from 932,377 residents in 2010 to 1.6 million by 2060. Today,of the 932,377 people some 470,000 are Hispanic or about half.That percentage will rise to about 60% in 2060. Of the 1.6 million population in Fresno County in 2060 – 989,000 will be Hispanic says the state study.
In Tulare County the Hispanic majority will grow to more than two thirds, about 68% Hispanic in 2060 to 548,000 Hispanics out of a total 836,500. Tulare County is around 60% Hispanic today.
Kern County’s population will grow faster than most large metro counties in the state by 2060 says the projection with 2.05 million residents from 841,000 in 2010. Kern’s Hispanic population will be around 60% in 2060 at 1.22 million says the state. It was 49.3 % Hispanic and 38.7 percent white in 2010. Kern’s growth will outpace Fresno County – roughly matching Sacramento’s expected growth – the two bookends of the San Joaquin. Buoyed by natural resources and opportunity in oil, renewable energy, ag and merchandise distribution, the county is a beacon for investment on multiple fronts.
Mega-counties like Los Angeles is expected to grow more slowly on a percentage basis from 9.8 million to 11.5 million residents in 2060.
By 2060, California will have 13 counties of one million or more, with eight of those with 2 million
or more residents. Six of the counties with at least one million will be inland counties. The four
new counties reaching one million will be Fresno, Kern, San Joaquin, and Ventura. California’s population will cross the 50 million mark in 2049 and grow to
nearly 52.7 million by 2060 says the report.
Other points covered by the report:
– For the population as a whole, the median age will increase from 35.2 to 41.9 years old.
Whites have the highest median age in 2010 (44.5) while Asians have the highest in
2060 (47.0). Hispanics’ median age (27.2 in 2010 and 39.0 in 2060) is consistently
lower than all other race groups other than Multi-Race.
– In 2030, there will be 9.6 million Hispanics in the prime working ages of 25 to 64; Whites
will have 7.2 million and Asians 3.1 million. By 2060, Hispanics will be the largest group
in the working ages by a considerable margin: 12.1 million Hispanics to 7.4 million
Whites and 3.2 million Asians.
– Southern California will lead the State’s growth over the next 50 years (2010 to 2060),
growing by 8.3 million to 31 million in population. For this report, in the interest of
geographic simplicity, Southern California includes San Luis Obispo, Santa Barbara,
Kern, San Bernardino, Ventura, Los Angeles, Orange, Riverside, San Diego, and
Imperial counties
-The San Joaquin Valley will add 3 million new Californians, growing from 3.1 million to
6.2 million. Valley gains will be led by San Joaquin County (growing by 852,000), and
Fresno County (growing by 683,000). For the purpose of this report, the San Joaquin
Valley includes San Joaquin, Stanislaus, Merced, Madera, Fresno, Kings, and Tulare
counties. Please note, for this report Kern County was included in the Southern
California region and not the San Joaquin Valley region.
 Wow! Gas prices have fallen to $2.89 a gallon at one Costco station in Lodi area – as the average price of regular in California continues to drop.
The average price in the state has declined from $4.66 on 10/07/12 to $3.51 today according to Gas Buddy. The trend continues to suggest lower prices,a a gift to the motorists after the run up in September by 50 cents in just a few days. The low price in the S2S reading area is $3.24 in Fresno, $3.33 at Costco Visalia, $3.25 in Tulare,$3.35 inHanford and $3.51 at the Costco in San Luis Obispo.
C.A.R. reports that California’s existing homes continued to sell at a faster pace in November, with the median number of days it took to sell a single-family home falling to 37.5 days in November 2012 from 38 days in October and down from a revised 56.6 days for the same period a year ago.
Median time on the market in November is 48 days in SLO – down from 64 days a year ago, down to 26 days from 36 days in the Fresno market and down in Tulare County from 42 days to 24 days.Kings County time on the market improved from 45 days a year ago to 43.
Meanwhile regards the median sales price SLO county now has a $391,000 median compared to $354,000 a year ago.Tulare County median is $138,000 vs $126,000 a year ago.
The statewide median price of an existing, single-family detached home increased 2.3 percent from October’s $341,370 median price to $349,300 in November. November’s price was up 24.8 percent from a revised $279,910 recorded in November 2011, marking the ninth consecutive month of annual price increases and the fifth consecutive month of double-digit annual gains. The year-to-year percentage increase was the largest since June 2004.
So far, California is on track for an average to under-average rainfall year as of November 21 at 8 AM. But it’s been a great 48 hours in the Shasta region north of Redding where rainfall totals include 6 to 7 inches in some foothill and mountain locations (see map). The great thing about heavy rain here – Shasta reservoir collects the stuff to store and send south when the rest of the state needs it.
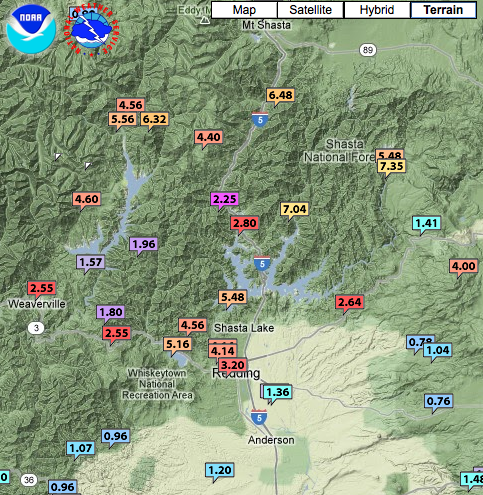
Shasta Dam rain went from zero precipitation a month ago to nearly 11 inches total in this water year as of today.Shasta is the headwater for the federal CVP hydraulic empire. The state’s top reservoir is Oroville that went from zero rain Oct 21 to 5 inches today, a nice start.
The state says snow water equivalents today stand at just 66% of normal for this time of year. Sacramento is expecting light rain today but no new storm until November 30.
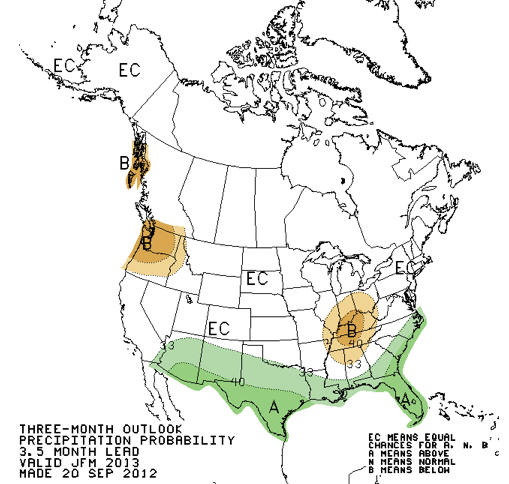 A September 20 NOAA Climate Prediction Center forecast is suggesting a change in the forecast for a wet winter across California in coming months. Even a month ago the CPC was showing prediction maps displaying increased likelihood of rain in the traditional wet months starting in December. Now the agency’s prediction maps maps are calling for simply “equal chances “ for a wet season although the Southwest gets wet and Pacific northwest looks drier than normal.
The forecast change relies on models showing a weakening of the trend for warmer than normal temps along the equator.
The Sept 20 CPC discussion says this.”DYNAMICAL FORECASTS, HOWEVER, ARE WEAKER NOW THAN 1 AND ESPECIALLY 2 MONTHS AGO. STATISTICAL MODELS GENERALLY HAVE PREDICTED SMALLER SST ANOMALIES. WHILE IT IS UNCERTAIN AT THIS TIME HOW LARGE SST ANOMALIES WILL BE OR HOW MUCH THEY WILL ALTER THE LARGE SCALE CIRCULATION IMPACTING NORTH AMERICA IT NOW SEEMS UNLIKELY THAT A STRONG EL NINO WILL DEVELOP.”
PG&E forecaster John Lindsey has said recently as well that he does not see a wet year for Central California this winter.

The National Snow and Ice Data Center (NSIDC) is part of the Cooperative Institute for Research in Environmental Sciences at the University of Colorado Boulder. NSIDC scientists provide Arctic Sea Ice News & Analysis content, with partial support from NASA.
BOULDER, Colorado—Arctic sea ice cover likely melted to its minimum extent for the year on September 16, according to scientists at the National Snow and Ice Data Center (NSIDC). Sea ice extent fell to 3.41 million square kilometers (1.32 million square miles), now the lowest summer minimum extent in the satellite record.
“We are now in uncharted territory,” said NSIDC Director Mark Serreze. “While we’ve long known that as the planet warms up, changes would be seen first and be most pronounced in the Arctic, few of us were prepared for how rapidly the changes would actually occur.”
Arctic sea ice cover grows each winter as the sun sets for several months, and shrinks each summer as the sun rises higher in the northern sky. Each year, the Arctic sea ice reaches its minimum extent in September. This year’s minimum follows a record-breaking summer of low sea ice extents in the Arctic. Sea ice extent fell to 4.10 million square kilometers (1.58 million square miles) on August 26, breaking the lowest extent on record set on September 18, 2007 of 4.17 million square kilometers (1.61 million square miles). On September 4, it fell below 4.00 million square kilometers (1.54 million square miles), another first in the 33-year satellite record.
“The strong late season decline is indicative of how thin the ice cover is,” said NSIDC scientist Walt Meier. “Ice has to be quite thin to continue melting away as the sun goes down and fall approaches.”
NSIDC scientists have observed fundamental changes in the Arctic’s sea ice cover. The Arctic used to be dominated by multiyear ice, or ice that survived through several years. Lately, the Arctic is increasingly characterized by seasonal ice cover and large areas are now prone to completely melt away in summer.
“The later minimum date is somewhat surprising because we expected that the late melt in the Chukchi and East Siberian seas would result in cool surface waters that would quickly refreeze once the atmosphere cooled,” Meier said. “However, ice loss continued north of the Laptev Sea, opening up a gap in the ice cover that reduced extent.”
STATELINE, NV – Governor Edmund G. Brown Jr. today used the occasion of the annual Tahoe Summit to launch a new website, Climate Change: Just The Facts, that documents the dangerous effects of global warming and calls on those who still deny its existence to “wake up and honestly face the facts.”
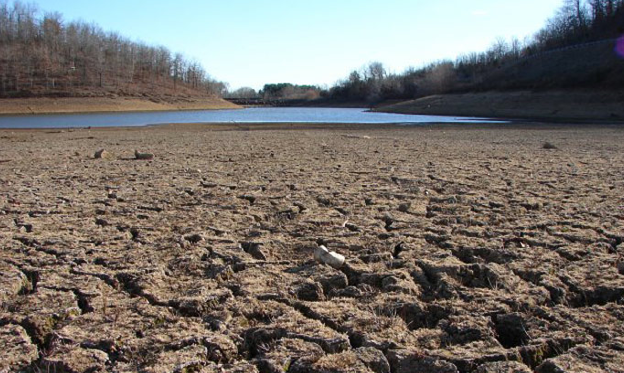 “Global warming’s impact on Lake Tahoe is well documented. It is just one example of how, after decades of pumping greenhouse gases into the atmosphere, humanity is getting dangerously close to the point of no return,” said Governor Brown. “Those who still deny global warming’s existence should wake up and honestly face the facts.”
The impacts of climate change are clear and global.
• America is seeing dramatic increases in food prices as a direct result of the worst drought in a half century. According to the National Center for Atmospheric Research, the percentage of the Earth’s surface suffering drought has more than doubled since the 1970s.
• Last year, Arctic sea ice was at the lowest level ever recorded. Satellite images show that Arctic summer sea ice has decreased nearly nine percent per decade since 1979.
• Last week a study published in the Proceedings of the National Academy of Sciences showed that events like the Russian heat wave of 2010 and the European heat wave of 2003 would likely not have happened without global warming caused by greenhouse gases.
Global warming’s impact on Lake Tahoe is well documented.
• In 2010, scientists at NASA’s Jet Propulsion Laboratory confirmed that over the last 25 years, the world’s largest lakes, including Lake Tahoe, have been steadily warming, some by as much as four degrees Fahrenheit. This is seven times faster than air temperatures have risen over the same period in some cases.
• That same year, researchers at UC Davis studied the impacts of climate change on the Lake Tahoe basin and concluded that there will be a continuing shift from snowfall to rain, earlier snowmelt and more runoff; an increase in drought severity, especially toward the end of the century; and a dramatic increase in flood magnitude in the middle third of the century.
• In 2008, a UC Davis study predicted that climate change will irreversibly alter water circulation in Lake Tahoe, radically changing the conditions for plants and fish in the lake.
• In 2005, researchers found that Lake Tahoe is warming at almost twice the rate of the world’s oceans because of global climate change.
Despite overwhelming evidence to the contrary there are still recalcitrant skeptics who ignore the findings of climate scientists and assert that global warming is not a problem.
The Climate Change: Just The Facts website debunks the claims of deniers and documents the serious impact of climate change on California – its economy, environment and public health. The site details:
• How rising global temperatures have far-reaching consequences for Californians, including sea level rise, more frequent and hotter heat waves, a declining water supply and large, intense wildfires.
• How every major scientific organization in the United States with relevant expertise has confirmed the Intergovernmental Panel on Climate Change’s finding that there is a 90 percent probability human activities are causing global warming.
• California’s groundbreaking efforts to reduce greenhouse gas emissions and prepare for the unavoidable effects of global warming which are now irreversible.
Governor Brown has pressed for increasing investment in renewable energy, efficiency and reduced dependency on fossil fuels. Last year, he signed legislation to increase California’s use of renewable energy to 33 percent by 2020.
A link to the website can be found here: http://www.opr.ca.gov/climatechangefacts.

Chances for a wet winter in Central and Southern California improved in recent weeks as the NOAA Climate Prediction Center indicates the likelihood an El Nino pattern will persist through winter. The forecasters say warming tropical Pacific waters this summer means a switch from a La Nina last winter into an El Nino pattern by September.
“El Niño is favored beginning in July-September 2012 and continuing through Northern Hemisphere winter 2012-13.”says the agency statement.
The strength of the El Nino remains in doubt however depending on how warm the equatorial Pacific waters get in coming months.
An El Nino tends to usher winter storms into California instead of the Pacific Northwest as the storm pattern was this past winter when much of Central California was well below average rainfall. Drought conditions can have a major effect on the state’s economy.
Competing models are predicting a modest El Nino while others suggest a strong pattern as a result of very warm water temps around the equator off the coast of South America.
The Climate Prediction Center maps(see above) for Jan/Feb/March show equal chances for average precipitation in areas on the map indicated in white and a 33% chance of wet conditions in the map’s light green areas and a higher 40% chance for wet weather in the dark green areas like Central and Southern California this winter from December through April.
The last El Nino pattern was in the winter of 2009/10
As climate change threatens to reshape California’s landscape, UC Davis researchers are helping to inform policymakers about the state’s vulnerability and provide strategies for adaptation.
The UC Davis research appears in a report, “Our Changing Climate,” released today by the California Natural Resources Agency and the California Energy Commission. The report is the third assessment from the California Climate Change Center since 2006.
UC Davis scientists authored nine of the 35 studies contained in the report. The UC Davis work addresses climate change impacts on native fishes, agriculture, urban planning, water management and other issues:
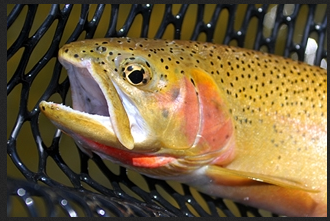
* Peter Moyle, a wildlife, fish and conservation biology professor in the UC Davis Center for Watershed Sciences, studied the predicted effects of climate change on native fishes. His team found that most native fishes will suffer population declines, and some will likely go extinct. Fishes requiring cold water are particularly vulnerable.
Meanwhile, non-native fishes are expected to increase, although they will also experience habitat loss during severe droughts.
“California’s unique native fishes are already in steep decline, and climate change is making the situation worse,” Moyle said. “This is likely to increase the complexity of managing California’s water supply. Preventing predictable extinctions is possible but will require planning now for increased water temperatures and more variable flows.”
* James Thorne, a researcher in the Department of Environmental Science and Policy, helped create a model that simulates how rainfall interacts with the landscape. Thorne’s research group looked at hydrologic data from the past and present to help predict what may happen in the future. That model was used for other studies in the report, such as those regarding fire and agriculture, allowing cross comparisons among the researchers’ work.
Thorne also looked at six different policy options for urban growth, including smart-growth, infill and “business as usual” approaches.
“If we want the most lands preserved for a variety of different purposes — agricultural and biodiversity protection, reduced fire threats — the infill policy was best,” Thorne said.
* Studies by Louise Jackson, UC Cooperative Extension specialist and professor in the Department of Land, Air and Water Resources at UC Davis, complemented Thorne’s growth policy conclusion. Her group’s case study focused on greenhouse gas emission mitigation and adaptation to climate change in Yolo County. They found that “channeling much or all future urban development into existing urban areas” will help preserve agricultural land and open space, reduce Yolo County’s greenhouse gas emissions and enhance agricultural sustainability. Their research also found that farmers concerned about climate change were more likely to voluntarily adopt practices that would conserve water and reduce greenhouse gas emissions.
Jackson’s group also developed an agricultural vulnerability index for California that identified four areas as especially vulnerable to the effects of climate change: the Sacramento-San Joaquin Delta; Salinas Valley; the corridor between Merced and Fresno; and the Imperial Valley.
* Jay Lund, director of the UC Davis Center for Watershed Sciences, examined climate change adaptations for managing water in the San Francisco Bay Area. His group’s research suggests that Bay Area urban water demands can be largely met even under severe forms of climate change, but at a cost. The cost includes buying water from agricultural users, using more expensive alternatives such as water recycling and desalination, and some increased water scarcity. A shared connection of public water systems, or interties, recently completed for emergency response, greatly aids adaptation, the study reports.
* Joshua Viers, associate director of the Center for Watershed Sciences, co-authored a study analyzing “water year” classifications.
These indices determine whether a year is considered wet, dry or in-between, as well as how much water is allocated and who gets it.
“Unfortunately, the method to distinguish different water year types is indexed to historical climatic conditions and is intended to represent an equal chance for any given year,” said Viers. “Our science suggests that future climatic conditions are not likely to represent this history, and thus water management agencies may need to reconsider these arbitrary indexing thresholds going forward to achieve a more equitable situation.”
Viers also co-authored a study about climate change’s impact on hydropower production in the Sierra Nevada. It found that an 11 F increase in air temperature would reduce hydropower in the area by about 10 percent, and that most reductions would occur in the northern Sierra Nevada. The central Sierra Nevada would adapt better to changes in runoff, while hydropower generation in the southern watershed would decrease.
Other institutions, including UC Berkeley, UC Santa Cruz, Stanford, the Scripps Institution of Oceanography, and Lawrence Berkeley National Laboratory researched climate change impacts on electricity consumption, sea level, wildfires and coastal flooding.
This assessment will provide a foundation for the state’s 2012 Climate Adaptation Strategy, with completion expected in December 2012. Comprised of scientific studies from several academic institutions, the assessment is directed by the Governor’s Office and intended to help state and local communities protect public health, grow the state’s economy, ensure energy reliability and safeguard the environment.


