California Export Trade Resumes Growth, Despite Global Turmoil

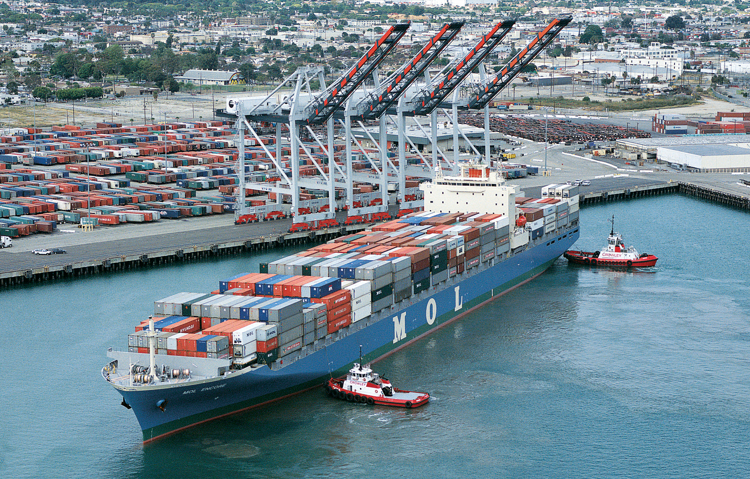
 LOS ANGELES, CALIFORNIA – California’s export trade recovered from its April stumble and resumed a positive growth track in May, according to an analysis by Beacon Economics of foreign trade data released this morning by the U.S. Commerce Department.

The value of goods shipped abroad by California businesses in May totaled $13.88 billion, a nominal increase of 5.2% over the $13.20 billion recorded in May 2011.

California exports to the European Union were down 10.3% from May of last year, while export shipments to the nations of the Pacific Rim were up 4.0%. Mexico continued to be the state’s largest and most vibrant export market, with exports in May up by 23.9% over May 2011.

“Given the generally parlous condition of the global marketplace these past few months, May’s overall numbers demonstrate the resilience of California’s export industries,” said Jock O’Connell, Beacon Economics’ International Trade Adviser.

The state’s manufactured exports in May were particularly impressive, jumping by 7.4% from $8.54 billion last May to $9.18 billion this year. Re-exports nudged up by 2.2% from $2.93 to $3.00 billion. However, exports of non-manufactured goods – chiefly agricultural products and raw materials – did slip by 1.1% from $1.72 billion in May 2011 to $1.70 billion this May.

The growth in manufactured exports has been particularly helpful in boosting manufacturing employment in the state, which is up by more than 10,000 jobs since hitting bottom in September 2009, according to Beacon Economics’ Director of Economic Research Jordan Levine. “Although the pace of export growth has slowed from the double-digit increases we saw in 2010 and 2011, and despite the turmoil abroad, continued solid demand for California-made goods and services is helping drive employment in the manufacturing sector,” Levine said.

Beacon Economics’ analysis also reported that, adjusting for inflation, the value of California’s exports so far in 2012 is running approximately 5% ahead of 2008, formerly the peak year for the state’s export trade.

“With the dollar stronger by more than 13% over last year at this time, much of Europe mired in recession, and slowing economic growth in major economies in Asia and South America, California exporters are facing some severe headwinds but are still coming out ahead of the game,” O’Connell said.

Still, global economic conditions could deteriorate further and affect California’s export trade, especially if efforts by European leaders to resolve the European Union’s debt drama continue to leave the world’s financial markets unimpressed, according to O‘Connell.

New NOAA Report Examines Climate Conditions

 –Warmer & Saltier Ocean

The lead character of the 2011 climate story was a double dip La Niña, which chilled the Pacific at the start and end of the year. Many of the 2011 seasonal climate patterns around the world were consistent with common side effects of La Niña.
Worldwide, 2011 was the coolest year on record since 2008, yet temperatures remained above the 30 year average, according to the 2011 State of the Climate report released online today by NOAA. The peer-reviewed report, issued in coordination with the American Meteorological Society (AMS), was compiled by 378 scientists from 48 countries around the world. It provides a detailed update on global climate indicators, notable weather events and other data collected by environmental monitoring stations and instruments on land, sea, ice and sky.
“2011 will be remembered as a year of extreme events, both in the United States and around the world,” said Deputy NOAA Administrator Kathryn D. Sullivan, Ph.D. “Every weather event that happens now takes place in the context of a changing global environment. This annual report provides scientists and citizens alike with an analysis of what has happened so we can all prepare for what is to come.”
Two back-to-back La Niñas, each characterized by cooler-than-average water temperatures in the eastern equatorial Pacific, affected regional climates and influenced many of the world’s significant weather events throughout the year. These included historic droughts in East Africa, the southern United States and northern Mexico. La Niña conditions contributed to an above-average tropical cyclone season in the North Atlantic hurricane basin and a below-average season in the Eastern North Pacific. It was also associated with the wettest two-year period (2010–2011) on record in Australia, which was particularly remarkable as the wet conditions followed a decade-long dry spell.

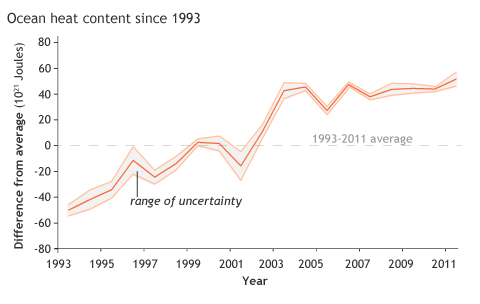
La Niña chilled the eastern tropical Pacific in 2011, but ocean heat content nearly everywhere else was above the long-term average. Maps and trend graphs of 8 additional are available from climate.gov.
The Arctic continued to show more rapid changes than the rest of the planet. Sea ice shrank to its second smallest “summer minimum” extent on record during 2011, as older ice (four to five years old) reached a new record minimum at more than 80 percent below average. Overall, glaciers around the world continued to lose mass. Loss from Canadian Arctic glaciers and ice caps were the greatest since measurements began in 2002.
The report used 43 climate indicators to track and identify changes and overall trends to the global climate system. These indicators include greenhouse gas concentrations, temperature of the lower and upper atmosphere, cloud cover, sea surface temperature, sea level rise, ocean salinity, sea ice extent and snow cover. Each indicator includes thousands of measurements from multiple independent datasets.
Highlights:
-Warm temperature trends continue: Four independent datasets show 2011 among the 15 warmest since records began in the late 19th century, with annually-averaged temperatures above the 1981–2010 average, but coolest on record since 2008. The Arctic continued to warm at about twice the rate compared with lower latitudes. On the opposite pole, the South Pole station recorded its all-time highest temperature of 9.9°F on December 25, breaking the previous record by more than 2 degrees.
-Greenhouse gases climb: Major greenhouse gas concentrations, including carbon dioxide, methane, and nitrous oxide, continued to rise. Carbon dioxide steadily increased in 2011 and the yearly global average exceeded 390 parts per million (ppm) for the first time since instrumental records began. This represents an increase of 2.10 ppm compared with the previous year. There is no evidence that natural emissions of methane in the Arctic have increased significantly during the last decade.
-Arctic sea ice extent decreases: Arctic sea ice extent was below average for all of 2011 and has been since June 2001, a span of 127 consecutive months through December 2011. Both the maximum ice extent (5.65 million square miles, March 7) and minimum extent (1.67 million square miles, September 9) were the second smallest of the satellite era.
-Ozone levels in Arctic drop: In the upper atmosphere, temperatures in the tropical stratosphere were higher than average while temperatures in the polar stratosphere were lower than average during the early 2011 winter months. This led to the lowest ozone concentrations in the lower Arctic stratosphere since records began in 1979 with more than 80 percent of the ozone between 11 and 12 miles altitude destroyed by late March, increasing UV radiation levels at the surface.

NOAA’s State of the Climate in 2011 report was published today by the Bulletin of the American Meteorological Society. For more, visit NOAA’s State of the Climate 2011 webpage

Download here. (Credit: NOAA). 

Sea surface temperature & ocean heat content rise: Even with La Niña conditions occurring during most of the year, the 2011 global sea surface temperature was among the 12 highest years on record. Ocean heat content, measured from the surface to 2,300 feet deep, continued to rise since records began in 1993 and was record high.
Ocean salinity trends continue: Continuing a trend that began in 2004 and similar to 2010, oceans were saltier than average in areas of high evaporation, including the western and central tropical Pacific, and fresher than average in areas of high precipitation, including the eastern tropical South Pacific, suggesting that precipitation is increasing in already rainy areas and evaporation is intensifying in drier locations.
The report also provides details on a number of extreme events experienced all over the globe, including the worst flooding in Thailand in almost 70 years, drought and deadly tornado outbreaks in the United States, devastating flooding in Brazil and the worst summer heat wave in central and southern Europe since 2003.
The 2011 State of the Climate report is peer-reviewed and published annually as a special supplement to the Bulletin of the American Meteorological Society. The report is part of a suite of climate services NOAA provides government, business and community leaders so they can make informed decisions. It was edited by Jessica Blunden, Ph.D., and Deke Arndt of NOAA’s National Climatic Data Center. The full report can be viewed online. The report highlights are available online.


NOAA Sees El Nino More Likely

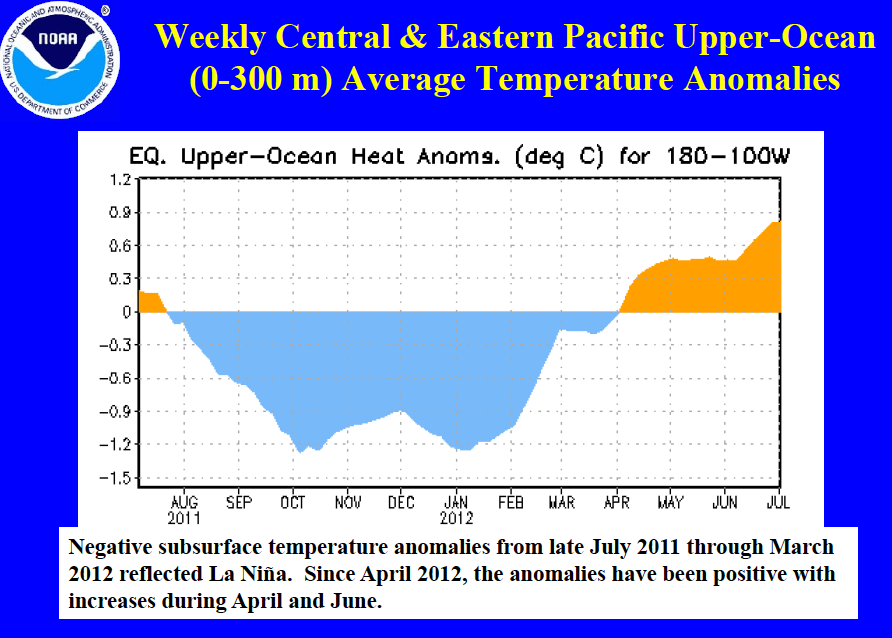
In their July 9 weekly posting, NOAA’s Climate PredictionCenter says”  chances increase for El Nino beginning July-September”  in their latest update. The oceanic heat content anomalies (average temperatures in the upper 300 meters of the ocean) increased during June,” says the report.

The diagnosis shows a heating up waters near the equator that is strengthening as summer goes on leading to more scientific models forecasting a stronger El Nino pattern developing and now virtually none forecasting a return of a La Nina pattern that we have been in.

El Nino, the periodic warming of central and eastern tropical Pacific waters, occurs on average every two to five years and typically lasts about 12 months.

A stronger and earlier El Nino could lead to a wetter winter this coming season in California that would ease concerns over another drought year.

June Was Cooler For Much Of California


Scorching Temps Fuel Drought in Midwest

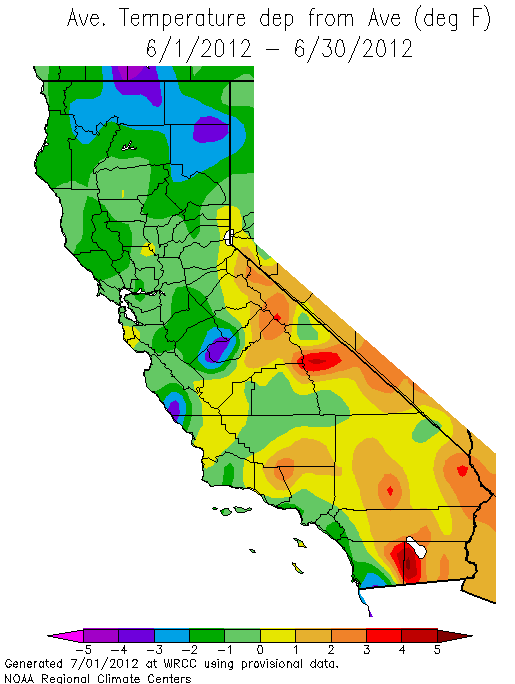
Much of central and northern California experienced slightly cooler than normal temperatures in June according of to Climate Tracker(see map). The map indicates a bit cooler June in SLO County and Tulare County with slightly higher than average temps in parts of southern California but not the South Coast.

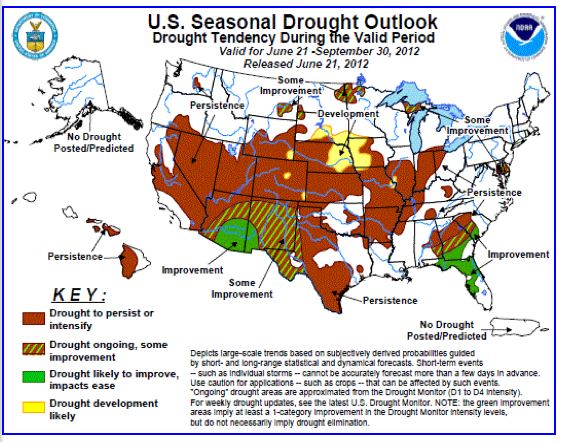
June was much tougher in the Midwest and in Colorado experiencing days of record high temperatures and growing drought conditions affecting the Midwest grain growing region and current corn crop(see map).In the Midwest with both triple digit temps and conditions that are hot and dry there are fears of a falling corn crop harvest.Of course Colorado and elsewhere in the West are seeing terrible wildfires.


NWS Hanford says both Bakersfield and Fresno experienced just above a normal June for high temps and slightly cooler low temps.On June 17th Fresno recorded 109 degrees besting the record of 107 set in 1917.

NWS calls for about average temps this week the Central Valley but not breaking 100.But Coast weather forecaster John Lindsey says  current cooler weather could change. Watch for high pressure to build in the West next week,affecting the state and offering a taste of what the rest of the US is suffering.

Taxable Sales/Fuel Sales In California Signal Economic Growth

2011 First Quarter Increased 9.0%; 2012 First Quarter Estimate Up 9.3%

Sacramento – In the first quarter of 2011, taxable sales in California rose 9.0 percent compared to the previous year, signaling economic growth, said Jerome E. Horton, Chairman of the California State Board of Equalization (BOE).

The growth rate of 9.0 percent was nearly twice as fast as two years ago in 2010 when the average growth was 4.6 percent.

An estimate of this year’s first quarter projects taxable sales of 9.3 percent, a pace similar to that of 2011. The 2012 figures are being compared to a similar period in 2011. The 2012 figures are an estimate subject to revisions, while the 2011 figures have been confirmed by BOE data.

“Taxable sales fuel the engine of economic growth and job creation that moves California forward,” said Chairman Horton. “Moving forward, we will continue to help our small businesses and will seek out new ways to help our companies grow by leveling the playing field and forging strong working relationships between government and private enterprise.”

Soaring gasoline prices, which rose 20.0 percent in the first quarter of 2011, required consumers to pay more at the pump and likely prompted many households to begin replacing aging vehicles. As a result, taxable sales made by gasoline stations increased 22.4 percent and those made by motor vehicle dealers increased 17.4 percent.
Statewide taxable sales by type of business for retail and food services rose 8.8 percent compared to all other nonretail businesses such as business equipment, construction materials, utilities, transportation, finance, insurance, real estate, entertainment, recreation, accommodation, and other services, which rose 9.5 percent, consistent with the national trend in the first quarter of 2011.

In related report thr state reported late last month for the first time in a year, gasoline consumption rose—2.1 percent—despite a hefty 12.6 percent increase in California gasoline prices, according to a report released today by Chairman Jerome E. Horton of the California State Board of Equalization (BOE). Gasoline prices jumped 12.6% to an average of $4.03 a gallon in February 2012, while consumption increased 2.1% compared to a year ago.

“Californians used more gasoline,” said Horton. “This could be a sign that economic activity is picking up and California’s economy is improving. In fact, in addition to the gasoline indicators, non-agricultural and manufacturing employment has increased over the same period last year and the unemployment rate is decreasing, as well as the average number of weeks of claimed unemployment benefits.

California Taxable Sales increased at a growth rate 2.3 percent faster than California Personal Income in the first quarter of 2011, the largest positive gap since 2005 (see chart)