Buying A Home – Notable Decline in First-time Buyers

Screen Shot 2014-11-08 at 5.06.49 PMWASHINGTON (November 3, 2014) – Despite an improving job market and low interest rates, the share of first-time buyers fell to its lowest point in nearly three decades and is preventing a healthier housing market from reaching its full potential, according to an annual survey released today by the National Association of Realtors®. The survey additionally found that an overwhelming majority of buyers search for homes online and then purchase their home through a real estate agent.

The 2014 National Association of Realtors® Profile of Home Buyers and Sellers continues a long-running series of large national NAR surveys evaluating the demographics, preferences, motivations, plans and experiences of recent home buyers and sellers; the series dates back to 1981. Results are representative of owner-occupants and do not include investors or vacation homes.

The long-term average in this survey, dating back to 1981, shows that four out of 10 purchases are from first-time home buyers. In this year’s survey, the share of first-time buyers* dropped 5 percentage points from a year ago to 33 percent, representing the lowest share since 1987 (30 percent).

Lawrence Yun, NAR chief economist, says there are many obstacles young adults are enduring on their path to homeownership. “Rising rents and repaying student loan debt makes saving for a downpayment more difficult, especially for young adults who’ve experienced limited job prospects and flat wage growth since entering the workforce,” he said. “Adding more bumps in the road, is that those finally in a position to buy have had to overcome low inventory levels in their price range, competition from investors, tight credit conditions and high mortgage insurance premiums.”

Yun adds, “Stronger job growth should eventually support higher wages, but nearly half (47 percent) of first-time buyers in this year’s survey (43 percent in 2013) said the mortgage application and approval process was much more or somewhat more difficult than expected. Less stringent credit standards and mortgage insurance premiums commensurate with current buyer risk profiles are needed to boost first-time buyer participation, especially with interest rates likely rising in upcoming years.”

The household composition of buyers responding to the survey was mostly unchanged from a year ago. Sixty-five percent of buyers were married couples, 16 percent single women, 9 percent single men and 8 percent unmarried couples.

In 2009, 60 percent of buyers were married, 21 percent were single women, 10 percent single men and 8 percent unmarried couples. Thirteen percent of survey respondents were multi-generational households, including adult children, parents and/or grandparents.

30-Year Fixed-Rate Mortgage Hits Year’s Low

August 24,2014

30-Year Fixed-Rate Mortgage Hits Year’s Low

MCLEAN, VA–(Marketwired – Aug 21, 2014) – Freddie Mac (OTCQB: FMCC) today released the results of its Primary Mortgage Market Survey® (PMMS®), showing average fixed mortgage rates following bond yields lower. Averaging 4.10 percent for the week, the 30-year fixed-rate mortgage fell below its previous 2014 low of 4.12 percent.

News Facts

  • 30-year fixed-rate mortgage (FRM) averaged 4.10 percent with an average 0.5 point for the week ending August 21, 2014, down from last week when it averaged 4.12 percent. A year ago at this time, the 30-year FRM averaged 4.58 percent.
  • 15-year FRM this week averaged 3.23 percent with an average 0.6 point, down from last week when it averaged 3.24 percent. A year ago at this time, the 15-year FRM averaged 3.60 percent.
  • 5-year Treasury-indexed hybrid adjustable-rate mortgage (ARM) averaged 2.95 percent this week with an average 0.5 point, down from last week when it averaged 2.97 percent. A year ago, the 5-year ARM averaged 3.21 percent.
  • 1-year Treasury-indexed ARM averaged 2.38 percent this week with an average 0.5 point, up from last week when it averaged 2.36 percent. At this time last year, the 1-year ARM averaged 2.67 percent.

Average commitment rates should be reported along with average fees and points to reflect the total upfront cost of obtaining the mortgage. Visit the following links for the Regional and National Mortgage Rate Details and Definitions. Borrowers may still pay closing costs which are not included in the survey.

Quotes
Attributed to Frank Nothaft, vice president and chief economist, Freddie Mac.

“Mortgage rates were down slightly this week, following the decline in 10-year Treasury yields. Meanwhile, housing starts [PDF] in July jumped 15.7 percent to 1.093 million units after falling 4.0 percent a month earlier. Also, July’s consumer prices [PDF] increased at a 0.1 percent seasonally adjusted pace, the slowest in five months.”

Negative Equity Share Of Homes Drops from 9.8M to 6.3M Properties

CoreLogic Reports 312,000 Residential Properties Regained Equity in Q1 2014

Core Logic report
Core Logic report

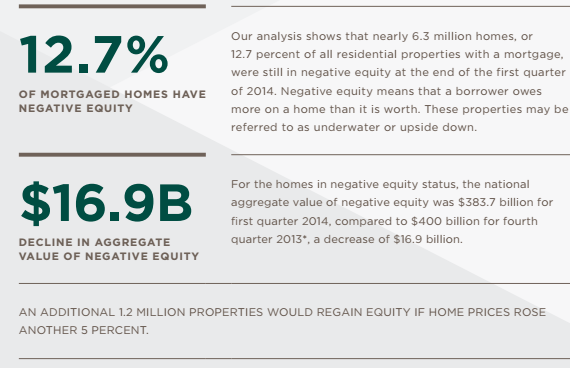
IRVINE, Calif., June 5, 2014—CoreLogic® (NYSE: CLGX), a leading global property information, analytics and data-enabled services provider, today released new analysis showing more than 300,000 homes returned to positive equity in the first quarter of 2014, bringing the total number of mortgaged residential properties with equity to more than 43 million. The CoreLogic analysis indicates that approximately 6.3 million homes, or 12.7 percent of all residential properties with a mortgage, were still in negative equity as of Q1 2014 compared to 6.6 million homes, or 13.4 percent for Q4 2013*. As a year-over-year comparison, the negative equity share was 20.2 percent, or 9.8 million homes, in Q1 2013. Negative equity, often referred to as “underwater” or “upside down,” means that borrowers owe more on their mortgages than their homes are worth. Negative equity can occur because of a decline in value, an increase in mortgage debt or a combination of both. For the homes in negative equity status, the national aggregate value of negative equity was $383.7 billion at the end of Q1 2014, down $16.9 billion from approximately $400 billion in the fourth quarter 2013. Of the 43 million residential properties with equity, approximately 10 million have less than 20- percent equity. Borrowers with less than 20-percent equity, referred to as “under-equitied,” may have a more difficult time refinancing their existing home or obtaining new financing to sell and buy another home due to underwriting constraints. Under-equitied mortgages accounted for 20.6 percent of all residential properties with a mortgage nationwide in Q1 2014, with more than 1.5 million residential properties at less than 5-percent equity, referred to as near-negative equity. Properties that are near-negative equity are considered at risk if home prices fall. “Despite the massive improvement in prices and reduction in negative equity over the last few years, many borrowers still lack sufficient equity to move and purchase a home,” said Sam Khater

, deputy chief economist for CoreLogic. “One in five borrowers have less than 10 percent equity in

their property, which is not enough to cover the down payment and additional costs associated

with a conventional mortgage.” “Prices continue to rise across most of the country and significantly fewer borrowers are underwater today compared to last year,” said Anand Nallathambi, president and CEO of CoreLogic. “An additional rise in home prices of 5 percent, which we are projecting will occur over the next 12 months, will lift another 1.2 million properties out of the negative equity trap.” Highlights as of Q1 2014: • Nevada had the highest percentage of mortgaged properties in negative equity at 29.4 percent, followed by Florida (26.9 percent), Mississippi (20.1 percent), Arizona (20.1 percent) and Illinois (19.7 percent). These top five states combined account for 31.1 percent of negative equity in the United States. • Of the 25 largest Core Based Statistical Areas (CBSAs) based on population, Tampa-St. Petersburg-Clearwater, Fla., had the highest percentage of mortgaged properties in negative equity at 29.5 percent, followed by Chicago-Naperville-Arlington Heights, Ill. (22.4 percent), Phoenix-Mesa-Scottsdale, Ariz. (20.6 percent), Atlanta-Sandy Springs-Roswell, Ga. (19.5 percent) and Warren-Troy-Farmington Hills, Mich. (18.3 percent). • Of the total $384 billion in negative equity, first liens without home equity loans accounted for $200 billion aggregate negative equity, while first liens with home equity loans accounted for $184 billion. • Approximately 3.8 million underwater borrowers hold first liens without home equity loans. The average mortgage balance for this group of borrowers is $218,000. The average underwater amount is $52,000. • Approximately 2.5 million underwater borrowers hold both first and second liens. The average mortgage balance for this group of borrowers is $290,000.The average underwater amount is $75,000. • Texas had the highest percentage of mortgaged residential properties in an equity position at 96.7 percent, followed by Montana (96.3 percent), Alaska (95.7 percent), North Dakota (95.7 percent) and Hawaii (95.6 percent). • Of the largest 25 Core Based Statistical Areas (CBSAs) based on population, Houston-

The Woodlands-Sugar Land, Texas had the highest percentage of mortgaged properties in an equity position at 97.0 percent; followed by Dallas-Plano-Irving, Texas (96.2 percent); Anaheim-Santa Ana-Irvine, Calif. (95.6 percent); Portland-Vancouver-Hillsboro, Ore. (94.8 percent) and Seattle-Bellevue-Everett, Wash. (93.7 percent). • Nationally, the number of homes with equity had a default rate of 0.6 percent, the same as in the previous quarter. However, homes with negative equity had a default rate of 3.5 percent as of Q1 2014, down from 3.7 percent in Q4 2013. • The bulk of home equity for mortgaged properties is concentrated at the high end of the housing market. For example, 93 percent of homes valued at greater than $200,000 have equity compared with 82 percent of homes valued at less than $200,000. *Fourth quarter 2013 data was revised. Revisions with public records data are standard, and to ensure accuracy, CoreLogic incorporates the newly released public data to provide updated results.

Faster Pace for Southland Home Sales; Median Sale Price Edges Higher

May 13, 2014


Screen Shot 2014-05-14 at 6.27.01 AMLa Jolla, CA—Southern California’s housing market perked up a bit in April, with sales rising more than usual from March and dipping below a year earlier by the smallest degree in six months. Home prices edged higher again but at a slower pace, the result of more inventory, affordability constraints and less pressure from investors, a real estate information service reported.

A total of 20,008 new and resale houses and condos sold in Los Angeles, Riverside, San Diego, Ventura, San Bernardino and Orange counties last month. That was up 13.4 percent from 17,638 sales in March, and down 6.6 percent from 21,415 sales in April last year, according to San Diego-based DataQuick.

On average, sales have increased 1.4 percent between March and April since 1988, when DataQuick’s statistics begin. Southland sales have fallen on a year-over-year basis for seven consecutive months, but last month’s decline was the smallest since sales fell 4.4 percent last October.

This April’s sales were higher than in April 2012 and 2011. That’s a significant change from February and March this year, which had the lowest home sales for those particular months in six years. Sales during the month of April have ranged from a low of 15,303 in 1995 to a high of 37,905 in 2004. Last month’s sales were 17.1 percent below the average – 24,133 – for all Aprils since 1988. March sales were 27 percent below average.

“The housing market’s pulse quickened a bit in April. If the inventory grows more, which we consider likely, it’s going to make it a lot easier for sales to reach at least an average level, which we haven’t seen in more than seven years. There are certainly factors undermining housing demand, including affordability constraints, credit challenges and less investment activity. But there are considerable forces fueling demand, too: Employment is rising, families are growing, and more people can qualify to buy again after losing a home to foreclosure or a short sale over the past eight years,” said Andrew LePage, a DataQuick analyst.

“There’s still pressure on home prices but it has moderated,” he said. “In April we logged the Southland’s lowest year-over-year gain in the median sale price – around 13 percent – since September 2012. In April last year the median rose 23 percent year-over-year. It’s tough to sustain that sort of price growth amid rising inventory, fewer investors, less-than-stellar income growth, higher mortgage rates and very limited availability of riskier ‘stretch’ financing.”

The median price paid for all new and resale houses and condos sold in the six-county region last month was $404,000, up 1.0 percent from $400,000 in March and up 13.2 percent from $357,000 in April 2013. Last month’s median was the highest since it was $408,000 in February 2008.

The median has risen on a year-over-year basis for 25 consecutive months. Those gains have been double-digit – between 10.8 percent and 28.3 percent – over the past 21 months. The 13.2 percent year-over-year gain in the median last month marked the lowest increase for any month since September 2012, when the $315,000 median rose 12.5 percent from a year earlier. Last month two counties – Orange and San Diego – saw single-digit, year-over-year gains in their medians.

April’s Southland median sale price stood 20.0 percent below the peak $505,000 median in spring/summer 2007.

DataQuick monitors real estate activity nationwide and provides information to consumers, educational institutions, public agencies, lending institutions, title companies and industry analysts. DataQuick was acquired in March by Irvine-based property information company CoreLogic.

Home prices continue to rise at different rates depending on price segment. In April, the lowest-cost third of the region’s housing stock saw a 20.6 percent year-over-year increase in the median price paid per square foot for resale houses. The annual gain was 17.1 percent for the middle third of the market and 9.6 percent for the top, most-expensive third.

Last month the number of homes that sold for $500,000 or more increased 9.3 percent from one year earlier, while $800,000-plus sales rose 5.8 percent. Sales below $500,000 fell 11.4 percent year-over year, while sales below $200,000 plunged 35.1 percent.

In April, 35.1 percent of all Southland home sales were for $500,000 or more, down from a revised 35.6 percent the month before and up from 30.5 percent a year earlier.

The market impact of distressed properties continued to wane.

Foreclosure resales – homes foreclosed on in the prior 12 months – accounted for 5.9 percent of the Southland resale market in April. That was down from a revised 6.3 percent the prior month and down from 12.4 percent a year earlier. In recent months the foreclosure resale rate has been the lowest since early 2007. In the current cycle, foreclosure resales hit a high of 56.7 percent in February 2009.

Short sales – transactions where the sale price fell short of what was owed on the property – made up an estimated 5.4 percent of Southland resales last month. That was down from a revised 7.3 percent the prior month and down from 16.6 percent a year earlier.

Absentee buyers – mostly investors and some second-home purchasers – bought 26.1 percent of the homes sold last month, which is the lowest share since November 2011, when 25.1 percent of homes sold to absentee buyers. Last month’s figure was down from 27.7 percent in March and down from 30.6 percent a year earlier. The peak was 32.4 percent in January 2013, while the monthly average since 2000, when the absentee data begin, is 18.7 percent. Last month’s absentee buyers paid a median $350,000, up 22.8 percent year-over-year.

In April 4.8 percent of all Southland homes sold on the open market were flipped, meaning they had previously sold in the prior six months. That’s down from a flipping rate of 5.3 percent the prior month and it’s down from 6.0 percent a year earlier. The peak was 7.0 percent in February 2013. (The figures exclude homes resold after being purchased at public foreclosure auctions on the courthouse steps).

Buyers paying cash last month accounted for 26.7 percent of Southland home sales, down from 29.8 percent the month before and down from 34.4 percent in April last year. The peak was 36.9 percent in February 2013. Since 1988 the monthly average for cash buyers is 16.5 percent of all sales. Cash buyers paid a median $380,000 last month, up 26.7 percent from a year earlier.

In April, Southern California home buyers forked over a total of $4.48 billion of their own money in the form of down payments or cash purchases. That was up from a revised $4.35 billion in March and down from $4.91 billion a year earlier. The out-of-pocket total peaked last May at $5.41 billion.

Credit conditions appear to have eased in recent months.

In April 14.1 percent of Southland home purchase loans were adjustable-rate mortgages (ARMs) – the highest share in six years and nearly double the ARM level of a year earlier. Last month’s figure was up from 13.2 percent in March and up from 7.9 percent in April 2013. The ARM rate dropped to as low as 1.9 percent in May 2009. Since 2000, a monthly average of about 31 percent of Southland purchase loans have been ARMs.

Jumbo loans, mortgages above the old conforming limit of $417,000, accounted for 29.3 percent of last month’s Southland purchase lending. That was down a hair from 29.7 percent in March, which had the highest jumbo level for any month since the credit crunch struck in August 2007. Last month’s figure was up from 26.1 percent a year earlier. Prior to August 2007 jumbos accounted for around 40 percent of the home loan market. The Southland jumbo level dropped to as low as 9.3 percent in January 2009.

All lenders combined provided a total of $6.15 billion in mortgage money to Southern California home buyers in April, up from a revised $5.08 billion in March and up from $5.56 billion in April last year.

The most active lenders to Southern California home buyers last month were Wells Fargo with 7.3 percent of the total home purchase loan market, JP Morgan Chase with 3.9 percent and Bank of America with 2.8 percent.

Government-insured FHA loans, a popular low-down-payment choice among first-time buyers, accounted for 18.8 percent of all purchase mortgages last month. That was up from 18.4 percent the month before and down from 21.7 percent a year earlier. In recent months the FHA share has been the lowest since early 2008, mainly because of tighter FHA qualifying standards and the difficulties first-time buyers have competing with investors and cash buyers.

The typical monthly mortgage payment Southland buyers committed themselves to paying last month was $1,607, up from $1,591 the month before and up from $1,275 a year earlier. Adjusted for inflation, last month’s typical payment was 34.1 percent below the typical payment in the spring of 1989, the peak of the prior real estate cycle. It was 46.0 percent below the current cycle’s peak in July 2007.

Indicators of market distress continue to decline. Foreclosure activity remains well below year-ago and far below peak levels. Financing with multiple mortgages is very low, and down payment sizes are stable, DataQuick reported.


Vacation Home Sales Pick Up Slack

from NAR

Screen Shot 2014-04-02 at 9.15.48 AMVacation home purchases recovered strongly in 2013, helping to offset some of the inevitable flagging interest in investment purchases the National Association of Realtors® (NAR) said today.  NAR’s 2014 Investment and Vacation Home Buyers Survey shows an increase in vacation-home sales during the year of 29.7 percent.  There were 553,000 such sales in 2012, an estimated 717,000 in 2013.

At the same time investment purchases retreated from the elevated levels of 2011 and 2012, falling 8.5 percent to 1.10 million in 2013 from 1.21 million in 2012.  There were 1.23 million such sales in 2011.  NAR’s investment sales figures do not include institutional sales.  Sales of owner-occupied homes rose 13.1 percent to 3.70 million last year from 3.27 million in 2012.

NAR Chief Economist Lawrence Yun said the pullback in investment activity is understandable. “Investment buyers slowed their purchasing in 2013 because prices were rising quickly along with a declining availability of discounted foreclosures over the course of the year,” he said.

“In 2011 and 2012, investment property was a no-brainer because home prices had sharply over corrected during the downturn in many areas, creating great bargains that could be quickly turned into profitable rentals. With a return to more normal market conditions, investors now have to evaluate their purchases more carefully and do their homework.”

Yun said the improvement in the vacation home market was also anticipated.  “Growth in the equity markets has greatly benefited high net-worth households, thereby providing the wherewithal and confidence to purchase recreational property.  However, vacation-home sales are still about one-third below the peak activity seen in 2006.”

About 13 percent of all 2013 sales were of vacation homes, up from an 11 percent share in each of the previous two years.  This was the highest that recreational property share has been since 2006.  The portion of sales accounted for by investment activity fell to 20 percent in 2013 from 24 percent the previous year.

The median investment-home price was $130,000 in 2013, up 13.0 percent from $115,000 in 2012, while the median vacation-home price was $168,700, up 12.5 percent from $150,000 in 2012.   The median owner-occupied home price was $189,000, a 2013 increase of 11.2 percent.  All cash purchases were common for both investment and vacation home transactions as were large down payments.  Forty-six percent of investment purchases were all cash while the median downpayment for buyers obtaining a mortgage was 26 percent.  The median downpayment for mortgaged vacation homes was 30 percent although 38 percent were all cash sales.  Distressed homes continued to play a significant role in the non-owner occupied market, accounting for 47 percent of investment sales and 42 percent of vacation homes.

While NAR said lifestyle factors were the primary motivation for vacation home buyers and rental income was driving investment purchases, the data also shows some blurring of the lines.  Five percent of vacation-home buyers reported they had already resold their property and while 9 percent plan to do so within a year. Buyers plan to own their recreational property for a median of 6 years, down from 10 years in 2012.

Yun said those figures “reflect the 28 percent of recreational property buyers who said they purchased to diversify investments or saw a good investment opportunity.”   Eighty-seven percent of recreational buyers did state an intent to use their property for vacations or a family retreat and 31 percent say they will eventually use it as a primary residence; 23 percent intend to rent the property to others.

Forty-one percent of vacation homes purchased last year were in the South, 28 percent in the West, 18 percent in the Northeast and 14 percent in the Midwest.  Sales of investment properties followed a similar pattern with 38 percent purchased in the South, 25 percent in the West, 18 percent in the Northeast and 19 percent in the Midwest.

California October Home Sales

Short Sales Fall Short

November 13, 2013

An estimated 36,468 new and resale houses and condos sold statewide last month. That was up 1.2 percent from 36,027 in September, and down 7.1 percent from 39,254 sales in October 2012, according to San Diego-based DataQuick.

October sales have varied from a low of 25,832 in 2007 to a high of 70,152 in 2003. Last month’s sales were 15.4 percent below the average of 43,092 sales for all the months of October since 1988, when DataQuick’s statistics begin.

The median price paid for a home in California last month was $357,000, up 0.6 percent from $355,000 in September and up 25.3 percent from $285,000 in October 2012. Last month was the 20th consecutive month in which the state’s median sale price rose year-over-year, and the 11th straight month with a gain exceeding 20 percent.

In March/April/May 2007 the median peaked at $484,000. The post-peak trough was $221,000 in April 2009.

Of the existing homes sold last month, 6.6 percent were properties that had been foreclosed on during the past year. It was the lowest level for foreclosure resales since June 2007, also at 6.6 percent. Last month’s figure was down from a revised 7.1 percent in September and 17.1 percent a year earlier. Foreclosure resales peaked at 58.8 percent in February 2009.

Short sales – transactions where the sale price fell short of what was owed on the property – made up an estimated 12.6 percent of the homes that resold last month. That was down from an estimated 13.1 percent the month before and 26.7 percent a year earlier.

The typical monthly mortgage payment that California buyers committed themselves to paying last month was $1,395, down from $1,437 the month before and up from $1,009 a year earlier. Adjusted for inflation, last month’s payment was 39.7 percent below the typical payment in spring 1989, the peak of the prior real estate cycle. It was 51.1 percent below the current cycle’s peak in June 2006. It was 51.2 percent above the February 2012 bottom of the current cycle.

DataQuick monitors real estate activity nationwide and provides information to consumers, educational institutions, public agencies, lending institutions, title companies and industry analysts.

Indicators of market distress continue to decline. Foreclosure activity remains well below year-ago and peak levels reached in the last five years. Financing with multiple mortgages is low, while down payment sizes are stable, DataQuick reported.

Mortgage Rates Falling

Screen shot 2012-06-22 at 7.11.11 AMOctober 23: Mortgage rates fell abruptly this week, after the long-awaited Employment Situation Report painted a bleaker-than-expected picture for labor markets.  The report was originally scheduled for October 4th, but was delayed due to the shutdown.  Conforming 30yr Fixed moved down to 4.125% for many borrowers depending on the scenario, though some lenders remain at 4.25%.
“Surprise bad number on the jobs report. Good for rates and I think the trend will continue. Weak numbers all around. Sub 4% may be just around the corner.”  said Mike Owens, Partner, Horizon Financial Inc.

Today, the ten year note fell to 2.48, the lowest level since late June.The rate helps determine mortgage rates meaning they are likely heading lower tomorrow.

Meanwhile Mortgage applications decreased 0.6 percent from one week earlier, according to data from the Mortgage Bankers Association’s (MBA) Weekly Mortgage Applications Survey for the week ending October 18, 2013.

Real Estate: HARP is a “No Brainer” – FHFA

Screen shot 2012-07-05 at 7.20.30 AM

Sep 23 2013


Feeling that they may have reached only about half of the families who could benefit from the program, the Federal Housing Finance Agency (FHFA) launched a campaign today to inform homeowners about the Home Affordable Refinance Program (HARP).  The campaign is aimed at those with higher than prevailing interest rates who are current on their mortgages but have too little equity in their homes to refinance through traditional programs.

FHFA, along with the government sponsored enterprises (GSEs) Freddie Mac and Fannie Mae, are working with mortgage companies throughout the country to get the word out about the benefits of HARP and FHFA has launched a new website, www.HARP.gov.  It has also enlisted Mike Aubrey, star of HGTV’s Power Broker to do a series of public service ads about HARP.  These will air in nine cities that suffered exceptionally large price declines in the housing bust and thus where homeowners are most likely to have little or no equity.

Aubrey called HARP “an absolute no brainer for eligible homeowners.”  The program, he said, allows underwater homeowners the option to refinance at a lower rate, “and in my book that is a great deal.  I spend my time on TV and as a realtor trying to get great deals for my clients. FHFA has already done the legwork to create an amazing deal.  It’s as simple as finding out if you qualify, getting the refinance done and watching the savings add up.”

Acting FHFA Director Edward J. DeMarco said that 2.8 million homeowners have refinanced through HARP but with mortgage rates still historically low and HARP eligibility requirements expanded, other qualified homeowners could reduce their monthly mortgage payments or build their equity faster with a shorter term mortgage through the program.

DeMarco told Bloomberg News in an interview this weekend that FHFA used focus groups to find out why borrowers with high rates hadn’t yet tried to refinance through HARP.  They found many didn’t realize they were eligible.  They thought they had to be delinquent on their mortgages before the government would help them.  DeMarco said he hoped the educational outreach would bring in an additional 2 million HARP borrowers.

To be eligible for a HARP refinance, homeowners must meet the following criteria:

  • The loan must be owned or guaranteed by Fannie Mae or Freddie Mac.
  • The mortgage must have been sold to Fannie Mae or Freddie Mac on or before May 31, 2009.
  • The current loan-to-value (LTV) ratio must be greater than 80 percent.
  • The borrower must be current on their mortgage payments with no late payments in the last six months and no more than one late payment in the last 12 months.

To find out if a mortgage is owned or guaranteed by Fannie Mae or Freddie Mac, borrowers can confirm their mortgage by visiting http://knowyouroptions.com/loanlookup or  https://ww3.freddiemac.com/corporate/.


Southland Median Sale Price Steady Month-to-Month, Up Sharply Year-Over-Year

September 12, 2013

Screen shot 2012-06-15 at 12.12.22 PMSouthern California home sales were the highest for an August in seven years as strong activity above $300,000 compensated for a dip in sales below that level, as well as fewer cash and investor purchases. The median sale price held steady compared with June and July but rose 24.6 percent from a year earlier, marking the eighth consecutive month with a year-over-year gain over 20 percent, a real estate information service reported.

A total of 23,057 new and resale houses and condos sold in Los Angeles, Riverside, San Diego, Ventura, San Bernardino and Orange counties last month. That was down 0.8 percent from a revised 23,253 sales in July, and up 2.8 percent from 22,438 sales in August 2012, according to San Diego-based DataQuick.

Last month’s sales were 12.8 percent below the average number of sales – 26,452 – in the month of August since 1988, when DataQuick’s statistics begin. Southland sales haven’t been above average for any particular month in more than seven years. August sales have ranged from 16,379 in August 1992 to 39,562 in August 2003.

The median price paid for all new and resale houses and condos sold in the six-county region last month was $385,000, the same as in June and July and up 24.6 percent from $309,000 in August 2012. The $385,000 median over the past three months is the highest since April 2008, when the median was also $385,000.

The median price has risen on a year-over-year basis for 17 consecutive months. Those gains have been double-digit – between 10.8 percent and 28.3 percent – over the past 13 months. Last month’s 24.6 percent annual gain in the Southland median was lower than the 28.3 percent annual increase in June and the 25.8 percent annual gain in July.

Last month’s median remained 23.8 percent below the peak $505,000 median in spring/summer 2007. The median fell by $256,000 from that peak to its $249,000 trough in April 2009, and it has now regained just over half of that peak-to-trough loss.

In a sign of continued market confidence, Southern California home buyers continue to put near-record amounts of their own money into residential real estate. In August they paid a total of $4.68 billion out of their own pockets in the form of down payments or cash purchases. That was down from a revised $5.18 billion in July and up from $4.24 billion a year ago. The out-of-pocket total peaked this May at $5.41 billion.

“There’s something for everyone in today’s housing data. Sellers have seen an amazing price jump from just a year ago, allowing many to finally sell at a profit. Home shoppers have more properties to choose as we begin to see a ‘supply response’ to higher values. Price pressures appear to be easing, though, amid higher mortgage rates, more supply and fewer cash and investor purchases. As we head into fall and winter, a slower time of year, we’ll probably see year-over-year price gains continue to taper,” said John Walsh, DataQuick president.

It appears that most of last month’s 24.6 percent year-over-year increase in the Southland median sale price reflects rising home prices, while a small portion reflects a change in market mix. (This change consists of a big increase in mid- to high-end sales and a big decline in sales of lower-cost distressed properties.)

In August, the lowest-cost third of the region’s housing stock saw a 23.3 percent year-over-year rise in the median price paid per square foot for resale houses. The annual gain was 21.2 percent for the middle third of the market and 17.4 percent for the top, most-expensive third.

Sales activity in the middle and upper price ranges continues to far outpace sales in the more affordable markets.

Last month the number of homes that sold from $300,000 through $800,000 – a range that would include many move-up buyers – rose 31.4 percent year-over-year. The number that sold for $500,000 or more jumped 48.7 percent from one year earlier, while $800,000-plus sales rose 48.0 percent.

In August, 32.6 percent of all Southland home sales were for $500,000 or more, down from a revised 33.2 percent of sales the month before and up from 23.3 percent a year earlier.

The number of Southland homes that sold below $200,000 last month dropped 32.8 percent year-over-year, while sales below $300,000 fell 24.9 percent. Low-end sales have been relatively weak largely because of an inadequate supply of homes for sale. Many owners still can’t afford to sell their homes because they owe more than they are worth, and lenders aren’t foreclosing on as many properties, further limiting supply.

In August, foreclosure resales – homes foreclosed on in the prior 12 months – accounted for 7.1 percent of the Southland resale market. That was down from a revised 7.7 percent the month before and down from 19.2 percent a year earlier. Last month’s foreclosure resale rate was the lowest since it was 5.5 percent in June 2007. In the current cycle, foreclosure resales hit a high of 56.7 percent in February 2009.

Short sales – transactions where the sale price fell short of what was owed on the property – made up an estimated 13.6 percent of Southland resales last month. That was the lowest level since it was also 13.6 percent in April 2009. Last month’s short sale figure was down from an estimated 14.6 percent the month before and down from 26.6 percent a year earlier.

Absentee buyers – mostly investors and some second-home purchasers – bought 26.3 percent of the Southland homes sold last month, which is the lowest share for any month since it was 25.1 percent in November 2011. Last month’s level was down from 27.4 percent the month before and down from 27.2 percent a year earlier. The absentee share has ratcheted down gradually each month this year since hitting a record 32.4 percent in January. The monthly average since 2000, when the absentee data begin, is 18.3 percent. Last month’s absentee buyers paid a median $310,000, up 31.4 percent from a year earlier.

After hitting a peak earlier this year, the share of homes flipped has generally trended flat to lower. Last month 6.0 percent of all Southland homes sold on the open market had previously sold in the prior six months. That’s the same as July’s flipping rate and up from 5.1 percent a year earlier. (The figures exclude homes resold after being purchased at public foreclosure auction sales on the courthouse steps).

Buyers paying with cash accounted for 27.6 percent of last month’s home sales, down from 30.0 percent the month before and down from 32.3 percent a year earlier. The cash share of purchases has declined each month since hitting an all-time peak of 36.9 percent this February, and in August was at its lowest level since it was 26.2 percent in September 2010. Since 1988 the monthly average for cash buyers is 16.2 percent of all sales. Cash buyers paid a median $325,000 last month, up 31.0 percent from a year ago.

Credit conditions continued to improve modestly.

Last month 11.6 percent of Southland home purchase loans were adjustable-rate mortgages (ARMs) – the highest for any month since ARMs were 12.6 percent of the market in July 2008. Last month’s ARM level was up from an ARM share of 10.9 percent the prior month and 5.9 percent a year earlier. Since 2000, a monthly average of about 32 percent of Southland purchase loans have been ARMs.

Jumbo loans, mortgages above the old conforming limit of $417,000, accounted for 27.2 percent of last month’s Southland purchase lending – the third-highest, behind June and July, since August 2007, when jumbos were 36.7 percent of the market. Last month’s figure was down from 27.9 percent the prior month and up from 20.3 percent a year earlier. In the months leading up to the credit crunch that struck in August 2007, jumbos accounted for around 40 percent of the home loan market.

The most active lenders to Southern California home buyers last month were Wells Fargo with 7.8 percent of the purchase loan market, Bank of American with 2.8 percent and IMortgage with 2.6 percent.

All lenders combined provided $6.36 billion in mortgage money to Southern California home buyers in August, down from $6.52 in July and up from $5.45 in July last year.

Government-insured FHA loans, a popular low-down-payment choice among first-time buyers, accounted for 19.1 percent of all purchase mortgages last month. That was up a hair from 19.0 percent the month before and down from 27.1 percent a year earlier. In recent months the FHA share has been the lowest since spring 2008. The decline reflects tighter FHA qualifying standards implemented in recent years as well as the difficulties first-time buyers have competing with investors and cash buyers.

DataQuick monitors real estate activity nationwide and provides information to consumers, educational institutions, public agencies, lending institutions, title companies and industry analysts.

The typical monthly mortgage payment Southland buyers committed themselves to paying last month was $1,545, up from $1,537 the month before and up from $1,124 a year earlier. Adjusted for inflation, last month’s typical payment was 35.5 percent below the typical payment in the spring of 1989, the peak of the prior real estate cycle. It was 47.1 percent below the current cycle’s peak in July 2007.

Indicators of market distress continue to decline. Foreclosure activity remains well below year-ago and far below peak levels. Financing with multiple mortgages is very low, and down payment sizes are stable, DataQuick reported.

Sales Volume Median Price
All homes Aug-12 Aug-13 %Chng Aug-12 Aug-13 %Chng
Los Angeles 7,917 8,038 1.50% $335,000 $429,000 28.10%
Orange 3,337 3,477 4.20% $445,000 $560,000 25.80%
Riverside 3,520 3,740 6.30% $210,000 $265,000 26.20%
San Bernardino 2,705 2,773 2.50% $168,000 $210,250 25.10%
San Diego 3,981 4,099 3.00% $345,250 $415,000 20.20%
Ventura 978 930 -4.90% $365,000 $450,000 23.30%
SoCal 22,438 23,057 2.80% $309,000 $385,000 24.60%


June Home Sales Ebb, As Median Home Price Continues Upward Trend

LOS ANGELES (July 16) – California home sales pulled back in June as home prices continued to climb, with most regions posting healthy double-digit year-over-year gains and the statewide median price maintaining above the $400,000 mark for the third straight month, the CALIFORNIA ASSOCIATION OF REALTORS® (C.A.R.) reported. “Despite a small increase in inventory, the supply of housing remains tight in most parts of the state and continues to fuel home price increases,” said C.A.R. President Don Faught.  “The surge in home prices in the past year has given homeowners with previous underwater properties an opportunity to become trade-up buyers.  However, many are finding this difficult because they either lack sufficient cash for a down payment or they are concerned that if they sell, they will have no place to go, given limited inventory.  Others may be waiting on the sidelines for values to gain even more before selling, which further contributes to tight inventory.”