
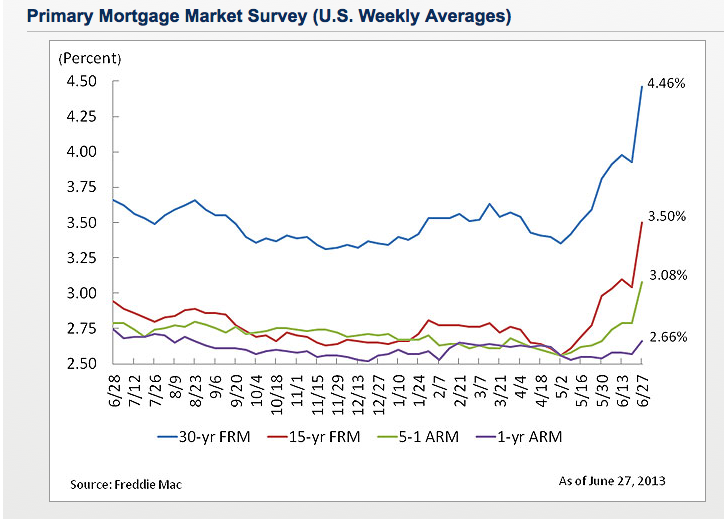
 MCLEAN, VA–(Marketwired – Jun 27, 2013) – Freddie Mac (OTCQB: FMCC) today released the results of its Primary Mortgage Market Survey® (PMMS®), showing average fixed mortgage rates jumping along with bond yields amid recent Fed remarks that it could begin tapering its bond purchases later this year. The average 30-year fixed-rate mortgage rose from 3.93 percent last week to 4.46 percent this week; the highest it has been since the week of July 28, 2011. This represents the largest weekly increase for the 30-year fixed since the week ended April 17, 1987. Despite the recent gains in mortgage rates, homebuyer affordability [PDF] remains strong for the typical family in most parts of the country, which should help fuel the ongoing housing recovery.
30-year fixed-rate mortgage (FRM) averaged 4.46 percent with an average 0.8 point for the week ending June 27, 2013, up from last week when it averaged 3.93 percent. Last year at this time, the 30-year FRM averaged 3.66 percent.
15-year FRM this week averaged 3.50 percent with an average 0.8 point, up from last week when it averaged 3.04 percent. A year ago at this time, the 15-year FRM averaged 2.94 percent.
5-year Treasury-indexed hybrid adjustable-rate mortgage (ARM) averaged 3.08 percent this week with an average 0.7 point, up from last week when it averaged 2.79 percent. A year ago, the 5-year ARM averaged 2.79 percent.
1-year Treasury-indexed ARM averaged 2.66 percent this week with an average 0.5 point, up from last week when it averaged 2.57 percent. At this time last year, the 1-year ARM averaged 2.74 percent.
Average commitment rates should be reported along with average fees and points to reflect the total upfront cost of obtaining the mortgage. Visit the following links for the Regional and National Mortgage Rate Details and Definitions. Borrowers may still pay closing costs which are not included in the survey.
Frank Nothaft, vice president and chief economist, Freddie Mac said “Following Fed chief Bernanke’s remarks on June 19th about the possible timing of reduced bond purchases, Treasury bond yields jumped over the week and mortgage rates followed. He indicated that the Fed may moderate the pace of its buying later this year and end the purchases around the middle of 2014.
“Higher mortgage rates may dampen some housing market activity but the effect will be muted by the high level of buyer affordability, and home sales should remain strong. For instance, existing home sales in May rose to its strongest pace since November 2009 and new home sales were the most seen since July 2008. In addition, the 12-month growth in the S&P/Case-Shiller® 20-city home price index for April of 12.1 percent was the largest since April 2006.”
Category: Real Estate

California May Home Sales Up 8.3% In May
 June 13, 2013
An estimated 42,293 new and resale houses and condos sold statewide last month. That was up 8.3 percent from 39,051 in April, and up 1.2 percent from 41,790 sales in May 2012, according to San Diego-based DataQuick.
Last month’s sales count was the strongest for a May since 54,099 homes were sold in May 2006. California May sales have varied from a low of 32,223 in 1995 to a high of 67,078 in 2005. Last month’s sales were 9.0 percent below the average of 46,471 sales for all the months of May since 1988, when DataQuick’s statistics begin.
The median price paid for a home in California last month was $340,000 – the highest for any month since the median was $354,000 in April 2008. Last month’s median rose 4.9 percent from $324,000 in April and rose 25.9 percent from $270,000 in May 2012. May marked the 15th consecutive month in which the state’s median sale price has risen year-over-year. In March/April/May 2007 the median peaked at $484,000. The post-peak trough was $221,000 in April 2009.
Of the existing homes sold last month, 11.4 percent were properties that had been foreclosed on during the past year – the lowest level since foreclosure resales were 9.4 percent of the resale market in August 2007. Last month’s figure was down from 13.5 percent in April and from 28.5 percent a year earlier. Foreclosure resales peaked at 58.8 percent in February 2009.
Short sales – transactions where the sale price fell short of what was owed on the property – made up an estimated 17.7 percent of the homes that resold last month. That was the same as in April and down from an estimated 23.7 percent a year earlier.

California’s Median Home Price Posts Highest Level in Nearly Five Years
 Median Up in SLO & Tulare Counties
LOS ANGELES–()–Strong sales in higher-cost coastal regions and heated market conditions drove California’s median home price to its highest level in March since May 2008, while inventory shortages continued to stifle home sales, the CALIFORNIA ASSOCIATION OF REALTORS® (C.A.R.)reported“While home sales were essentially flat from February, sales declined moderately from last year, as an extreme shortage of available homes continued to dictate the market,” said C.A.R. President Don Faught. “Statewide inventory dropped 36 percent from last March and was below 3 months for the second time in the past few months. Supply conditions are particularly tight in the lower-priced segment of the market, as inventory for homes priced below $300k plunged more than 50 percent from the previous year.”
Closed escrow sales of existing, single-family detached homes in California totaled a revised seasonally adjusted annualized rate of 417,520, according to information collected by C.A.R. from more than 90 local REALTOR® associations and MLSs statewide. March closings were up a slight 0.1 percent from a revised 417,310 in February but down 4.9 percent from a revised 439,260 in March 2012. The statewide sales figure represents what would be the total number of homes sold during 2013 if sales maintained the March pace throughout the year. It is adjusted to account for seasonal factors that typically influence home sales.
The statewide median price of an existing, single-family detached home climbed 13.7 percent from February’s $333,380 median price to $378,960 in March, reversing a two-month decline. The month-to-month increase was the highest since C.A.R. began tracking this statistic in 1979. The March price was up 28.2 percent from a revised $295,630 recorded in March 2012, marking the 13th consecutive month of annual price increases and the ninth consecutive month of double-digit annual gains.
“No doubt the dearth of home listings is driving the upsurge in the median price, as is an increase in sales in the higher-priced segments,” said C.A.R. Vice President and Chief Economist Leslie Appleton-Young. “Sales of homes priced $500,000 and higher are up more than 34 percent from last year, and have been on a rising trend since early 2012. Sales growth in the coastal regions – Marin, Orange, San Diego, and San Luis Obispo, in particular – helped push the statewide median price up to the highest level in more than four years.”
Other key facts of C.A.R.’s March 2013 resale housing report include:
- The available supply of homes for sale fell significantly in March, falling to a 2.9-month supply, as measured by C.A.R.’s Unsold Inventory Index. The March Unsold Inventory Index for existing, single-family detached homes was down from 3.6 months in February and down from 4.2 months in March 2012. The index indicates the number of months needed to sell the supply of homes on the market at the current sales rate. A six- to seven-month supply is considered normal.
- Mortgage rates edged up in March, with the 30-year fixed-mortgage interest rate averaging 3.57 percent, up from 3.53 percent in February but down from 3.95 percent in March 2012, according to Freddie Mac. Adjustable-mortgage interest rates also edged up, averaging 2.63 percent in March, up from 2.61 percent in February but down from 2.77 percent March 2012.
- Homes continued to move off the market faster in March, with the median number of days it took to sell a single-family home decreasing to 29.4 days in March, down from 34.2 days in February and down from a revised 52.2 days for the same period a year ago.
Multimedia:
Note: The County MLS median price and sales data in the tables are generated from a survey of more than 90 associations of REALTORS® throughout the state, and represent statistics of existing single-family detached homes only. County sales data are not adjusted to account for seasonal factors that can influence home sales. Movements in sales prices should not be interpreted as changes in the cost of a standard home. The median price is where half sold for more and half sold for less; medians are more typical than average prices, which are skewed by a relatively small share of transactions at either the lower-end or the upper-end. Median prices can be influenced by changes in cost, as well as changes in the characteristics and the size of homes sold. Due to the low sales volume in some areas, median price changes in March may exhibit unusual fluctuation. The change in median prices should not be construed as actual price changes in specific homes.
Leading the way…® in California real estate for more than 100 years, the CALIFORNIA ASSOCIATION OF REALTORS® (www.car.org) is one of the largest state trade organizations in the United States with 155,000 members dedicated to the advancement of professionalism in real estate. C.A.R. is headquartered in Los Angeles.
|
March 2013 County Sales and Price Activity |
||||||||||||||||||||||||
| March 2013 | Median Sold Price of Existing Single-Family Homes | Sales | ||||||||||||||||||||||
| State/Region/County |
March |
Feb. |
March |
MTM% |
YTY% |
MTM% |
YTY% |
|||||||||||||||||
| Calif. single-family (SAAR) | $ | 378,960 | $ | 333,380 | r | $ | 295,630 | r | 13.7 | % | 28.2 | % | 0.1 | % | -4.9 | % | ||||||||
| Calif. condo/townhomes | $ | 306,050 | $ | 272,520 | r | $ | 231,270 | r | 12.3 | % | 32.3 | % | 29.6 | % | -1.5 | % | ||||||||
| Los Angeles Metropolitan Area | $ | 352,510 | $ | 325,530 | $ | 276,270 | 8.3 | % | 27.6 | % | 27.9 | % | -8.1 | % | ||||||||||
| Inland Empire | $ | 227,920 | $ | 212,300 | $ | 179,500 | 7.4 | % | 27.0 | % | 22.3 | % | -16.8 | % | ||||||||||
| San Francisco Bay Area | $ | 636,150 | $ | 584,430 | $ | 478,330 | 8.8 | % | 33.0 | % | 40.4 | % | -9.0 | % | ||||||||||
| San Francisco Bay Area | ||||||||||||||||||||||||
| Alameda | $ | 578,310 | $ | 511,790 | $ | 425,000 | 13.0 | % | 36.1 | % | 48.4 | % | -2.5 | % | ||||||||||
| Contra-Costa (Central County) | $ | 721,870 | $ | 608,700 | $ | 582,070 | 18.6 | % | 24.0 | % | 34.1 | % | 3.1 | % | ||||||||||
| Marin | $ | 888,890 | $ | 859,370 | $ | 672,620 | 3.4 | % | 32.2 | % | 43.3 | % | 6.1 | % | ||||||||||
| Napa | $ | 430,950 | $ | 468,180 | $ | 351,470 | -8.0 | % | 22.6 | % | 31.2 | % | -16.5 | % | ||||||||||
| San Francisco | $ | 828,700 | $ | 750,000 | $ | 649,390 | 10.5 | % | 27.6 | % | 64.3 | % | -1.4 | % | ||||||||||
| San Mateo | $ | 912,000 | $ | 800,000 | $ | 677,900 | 14.0 | % | 34.5 | % | 43.4 | % | -17.0 | % | ||||||||||
| Santa Clara | $ | 730,000 | $ | 710,000 | $ | 575,250 | 2.8 | % | 26.9 | % | 43.3 | % | -11.7 | % | ||||||||||
| Solano | $ | 250,000 | $ | 234,520 | $ | 194,310 | 6.6 | % | 28.7 | % | 16.9 | % | -24.9 | % | ||||||||||
| Sonoma | $ | 398,090 | $ | 384,900 | $ | 317,650 | 3.4 | % | 25.3 | % | 38.9 | % | -4.6 | % | ||||||||||
| Southern California | ||||||||||||||||||||||||
| Los Angeles | $ | 340,890 | $ | 337,630 | $ | 272,920 | 1.0 | % | 24.9 | % | 24.3 | % | -5.9 | % | ||||||||||
| Orange County | $ | 619,430 | $ | 607,230 | $ | 485,300 | 2.0 | % | 27.6 | % | 45.6 | % | 4.1 | % | ||||||||||
| Riverside County | $ | 263,670 | $ | 245,830 | $ | 211,350 | 7.3 | % | 24.8 | % | 24.7 | % | -18.4 | % | ||||||||||
| San Bernardino | $ | 161,900 | $ | 156,360 | $ | 131,640 | 3.5 | % | 23.0 | % | 18.1 | % | -13.8 | % | ||||||||||
| San Diego | $ | 436,710 | $ | 407,220 | $ | 363,710 | 7.2 | % | 20.1 | % | 34.9 | % | 9.2 | % | ||||||||||
| Ventura | $ | 475,000 | $ | 461,960 | $ | 417,020 | 2.8 | % | 13.9 | % | 42.6 | % | 4.1 | % | ||||||||||
| Central Coast | ||||||||||||||||||||||||
| Monterey | $ | 359,900 | $ | 315,000 | $ | 314,900 | 14.3 | % | 14.3 | % | 35.5 | % | -2.1 | % | ||||||||||
| San Luis Obispo | $ | 417,590 | $ | 408,570 | $ | 380,140 | 2.2 | % | 9.9 | % | 42.9 | % | 5.6 | % | ||||||||||
| Santa Barbara | $ | 565,970 | $ | 562,500 | $ | 429,410 | r | 0.6 | % | 31.8 | % | 27.7 | % | -14.9 | % | |||||||||
| Santa Cruz | $ | 585,000 | $ | 435,230 | $ | 482,160 | 34.4 | % | 21.3 | % | 29.4 | % | -4.1 | % | ||||||||||
| Central Valley | ||||||||||||||||||||||||
| Fresno | $ | 160,510 | $ | 158,950 | $ | 134,690 | 1.0 | % | 19.2 | % | 10.7 | % | -9.5 | % | ||||||||||
| Kern (Bakersfield) | $ | 175,000 | $ | 169,950 | r | $ | 132,380 | 3.0 | % | 32.2 | % | 13.4 | % | -16.7 | % | |||||||||
| Kings County | $ | 146,000 | $ | 153,750 | $ | 139,090 | r | -5.0 | % | 5.0 | % | 31.7 | % | 0.0 | % | |||||||||
| Madera | $ | 136,000 | $ | 130,000 | $ | 125,000 | 4.6 | % | 8.8 | % | 64.7 | % | -30.0 | % | ||||||||||
| Merced | $ | 144,000 | $ | 125,290 | $ | 115,290 | 14.9 | % | 24.9 | % | -2.7 | % | -15.6 | % | ||||||||||
| Placer County | $ | 322,560 | $ | 312,090 | $ | 267,470 | r | 3.4 | % | 20.6 | % | 26.7 | % | -5.6 | % | |||||||||
| Sacramento | $ | 220,590 | $ | 203,540 | $ | 166,760 | r | 8.4 | % | 32.3 | % | 16.4 | % | -17.0 | % | |||||||||
| San Benito | $ | 348,000 | $ | 330,000 | $ | 232,350 | 5.5 | % | 49.8 | % | 23.3 | % | -1.9 | % | ||||||||||
| San Joaquin | $ | 191,280 | $ | 174,680 | $ | 158,480 | 9.5 | % | 20.7 | % | 13.2 | % | -22.9 | % | ||||||||||
| Stanislaus | $ | 168,870 | $ | 152,500 | $ | 134,650 | 10.7 | % | 25.4 | % | 25.3 | % | -15.9 | % | ||||||||||
| Tulare | $ | 137,560 | $ | 133,870 | r | $ | 122,630 | r | 2.8 | % | 12.2 | % | 27.9 | % | -20.3 | % | ||||||||
| Other Counties in California | ||||||||||||||||||||||||
| Amador | $ | 200,000 | $ | 225,000 | $ | 118,750 | -11.1 | % | 68.4 | % | 48.6 | % | 10.6 | % | ||||||||||
| Butte County | $ | 250,000 | $ | 211,760 | $ | 200,000 | 18.1 | % | 25.0 | % | 36.4 | % | 11.1 | % | ||||||||||
| El Dorado County | $ | 329,170 | $ | 307,900 | $ | 277,270 | 6.9 | % | 18.7 | % | 30.4 | % | 4.1 | % | ||||||||||
| Humboldt | $ | 225,000 | $ | 231,670 | $ | 223,330 | -2.9 | % | 0.7 | % | 21.9 | % | 17.1 | % | ||||||||||
| Lake County | $ | 145,000 | $ | 125,000 | $ | 110,000 | 16.0 | % | 31.8 | % | 77.3 | % | -10.3 | % | ||||||||||
| Tuolumne | $ | 158,000 | $ | 160,000 | $ | 165,000 | -1.3 | % | -4.2 | % | 43.5 | % | 1.5 | % | ||||||||||
| Mendocino | $ | 221,880 | $ | 259,090 | $ | 225,000 | -14.4 | % | -1.4 | % | -7.1 | % | -9.3 | % | ||||||||||
| Shasta | $ | 180,740 | $ | 180,530 | $ | 148,420 | 0.1 | % | 21.8 | % | 11.7 | % | 10.0 | % | ||||||||||
| Siskiyou County | $ | 123,330 | $ | 110,000 | $ | 110,000 | 12.1 | % | 12.1 | % | 85.0 | % | 105.6 | % | ||||||||||
| Tehama | $ | 156,670 | $ | 131,670 | $ | 108,000 | 19.0 | % | 45.1 | % | -5.1 | % | -15.9 | % | ||||||||||
| Yolo | $ | 250,000 | $ | 250,000 | $ | 213,040 | 0.0 | % | 17.3 | % | 64.3 | % | -4.2 | % | ||||||||||
|
r = revised |
||||||||||||||||||||||||
|
March 2013 County Unsold Inventory and Time on Market |
|||||||||||
| March 2013 | Unsold Inventory Index |
Median Time on Market |
|||||||||
| State/Region/County |
March |
Feb. |
March |
March |
Feb. |
March |
|||||
| Calif. single-family (SAAR) | 2.9 | 3.6 | 4.2 | 29.4 | 34.2 | 52.2 | r | ||||
| Calif. condo/townhomes | 2.5 | 3.2 | 4.1 | r | 28.6 | 33.5 | 56.2 | r | |||
| Los Angeles Metropolitan Area | 2.9 | 3.8 | 4.3 | 38.3 | 40.9 | 57.0 | |||||
| Inland Empire | 3.1 | 4.0 | 3.9 | 40.3 | 38.7 | 53.6 | |||||
| San Francisco Bay Area | 2.6 | 3.1 | 3.5 | 34.3 | 41.5 | 53.2 | |||||
| San Francisco Bay Area | |||||||||||
| Alameda | 2.1 | 2.6 | 3.3 | 50.2 | 57.0 | 74.6 | |||||
| Contra-Costa (Central County) | 2.2 | 2.6 | 3.4 | 48.4 | 58.0 | 75.7 | |||||
| Marin | 3.1 | 4.1 | 4.6 | 45.2 | 61.0 | 65.3 | |||||
| Napa | 4.7 | 5.4 | 5.9 | 55.9 | 73.7 | 82.8 | |||||
| San Francisco | 4.0 | 4.0 | 3.9 | 23.4 | 24.7 | 39.5 | |||||
| San Mateo | 2.4 | 2.9 | 2.4 | 19.7 | 20.0 | 25.1 | |||||
| Santa Clara | 2.1 | 2.4 | 2.5 | 18.3 | 20.9 | 24.3 | |||||
| Solano | 2.9 | 3.3 | 4.0 | 38.8 | 44.1 | 52.6 | |||||
| Sonoma | 3.4 | 4.3 | 4.9 | 50.3 | 63.4 | 91.0 | |||||
| Southern California | |||||||||||
| Los Angeles | 2.7 | 3.3 | 4.3 | 31.5 | 36.5 | 55.6 | |||||
| Orange County | 2.8 | 3.9 | 4.9 | 45.1 | 49.8 | 70.2 | |||||
| Riverside County | 3.0 | 3.9 | 3.8 | 41.1 | 40.2 | 58.5 | |||||
| San Bernardino | 3.3 | 4.1 | 4.1 | 39.0 | 38.7 | 44.5 | |||||
| San Diego | 3.3 | 4.3 | 5.1 | 26.6 | 34.7 | 52.1 | |||||
| Ventura | 3.6 | 5.2 | 5.8 | 47.2 | 54.2 | 73.4 | |||||
| Central Coast | |||||||||||
| Monterey | 2.9 | 3.8 | 4.0 | 26.1 | 28.3 | 50.9 | |||||
| San Luis Obispo | 3.6 | 5.0 | 4.7 | 36.0 | 37.5 | 75.0 | |||||
| Santa Barbara | 4.3 | 5.2 | 4.6 | 36.9 | 54.5 | 78.6 | r | ||||
| Santa Cruz | 3.0 | 3.6 | 4.0 | 29.8 | 34.5 | 43.4 | |||||
| Central Valley | |||||||||||
| Fresno | 3.8 | 3.9 | 4.5 | 27.2 | 26.4 | 36.4 | |||||
| Kern (Bakersfield) | 2.0 | 3.2 | r | 3.4 | 27.0 | 24.0 | r | 39.0 | |||
| Kings County | 2.7 | 3.3 | 3.6 | 50.6 | 55.2 | 66.4 | |||||
| Madera | 3.5 | 5.2 | 3.7 | 23.6 | 25.7 | 39.7 | |||||
| Merced | 2.6 | 2.5 | 3.7 | 27.1 | 24.7 | 44.9 | |||||
| Placer County | 2.4 | 2.8 | 3.8 | r | 21.2 | 24.1 | 42.1 | ||||
| Sacramento | 2.2 | 2.3 | 3.9 | r | 19.9 | 21.2 | 34.4 | r | |||
| San Benito | 2.1 | 2.1 | 3.4 | 21.8 | 23.3 | 37.4 | |||||
| San Joaquin | 2.2 | 2.6 | 3.5 | 21.3 | 23.0 | 41.4 | |||||
| Stanislaus | 2.0 | 2.5 | 3.9 | 20.7 | 21.7 | 36.4 | |||||
| Tulare | 3.2 | 4.0 | r | 4.0 | r | 26.9 | 28.5 | r | 33.5 | r | |
| Other Counties in California | |||||||||||
| Amador | 5.0 | 6.2 | 5.8 | 75.5 | 94.6 | 93.1 | |||||
| Butte County | 3.3 | 4.3 | 4.1 | 29.5 | 54.9 | 67.4 | |||||
| El Dorado County | 3.5 | 4.1 | 4.9 | 28.6 | 42.2 | r | 73.3 | ||||
| Humboldt | 4.8 | 5.7 | 6.9 | 56.0 | 73.1 | 53.6 | |||||
| Lake County | 5.7 | 9.4 | 5.5 | 72.6 | 95.8 | 66.6 | |||||
| Tuolumne | 4.9 | 6.7 | 5.9 | 45.5 | 31.0 | 64.6 | |||||
| Mendocino | 8.6 | 6.8 | 7.6 | 71.9 | 121.0 | 105.5 | |||||
| Shasta | 2.6 | 2.8 | 4.5 | 27.1 | 42.1 | 37.3 | |||||
| Siskiyou County | 9.0 | 15.1 | 19.9 | 108.4 | 84.2 | 82.8 | |||||
| Tehama | 5.1 | 4.9 | 5.5 | 28.1 | 56.4 | 56.4 | |||||
| Yolo | 2.3 | 3.5 | 4.6 | 22.4 | 23.1 | 40.2 | |||||
|
r = revised |
|||||||||||
Contacts
CALIFORNIA ASSOCIATION OF REALTORS®
Lotus Lou, (213) 739-8304
lotusl@car.org
Recent Stories
-
April 01, 2013LOS ANGELES–(BUSINESS WIRE)–“What starts with one California REALTOR® benefits all of California.” That’s the underlying sentiment of a new integrated consumer ad campaign from the CALIFORNIA ASS… more »
-
March 25, 2013LOS ANGELES–(BUSINESS WIRE)–Pending home sales in California rose in February from the previous month but were lower than year-ago levels. Meanwhile, equity sales rose to their highest level in n… more »
-
California Median Home Price Remains Strong; Buyers Confront Listings Shortage, C.A.R. Reports
March 15, 2013LOS ANGELES–(BUSINESS WIRE)–California’s median home price marked a full year of annual price gains, propelled by strong sales of higher-priced homes in February, while a lack of inventory constr… more »


Release Versions
- English
- EON: Enhanced Online News
Company Information Center
CALIFORNIA ASSOCIATION OF REALTORS
 Share
Share Email
Email  Print
Print


Mortgage Rates Dip Lower
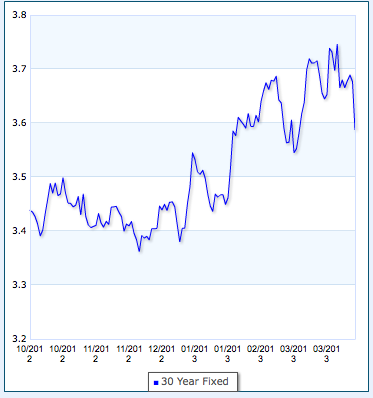
MCLEAN, VA–(Marketwired – Apr 4, 2013) – Freddie Mac (OTCQB: FMCC) today released the results of its Primary Mortgage Market Survey® (PMMS®), showing average fixed mortgage rates dipping for the week amid recent data which indicates the manufacturing industry is slowing. The average 30-year fixed-rate mortgage has seesawed around 3.5 percent for the past two months, providing ongoing help to the housing recovery.
News Facts
30-year fixed-rate mortgage (FRM) averaged 3.54 percent with an average 0.8 point for the week ending April 4, 2013, down from last week when it averaged 3.57 percent. Last year at this time, the 30-year FRM averaged 3.98 percent.
15-year FRM this week averaged 2.74 percent with an average 0.7 point, down from last week when it averaged 2.76 percent. A year ago at this time, the 15-year FRM averaged 3.21 percent.
5-year Treasury-indexed hybrid adjustable-rate mortgage (ARM) averaged 2.65 percent this week with an average 0.5 point, down from last week when it averaged 2.68 percent. A year ago, the 5-year ARM averaged 2.86 percent.
1-year Treasury-indexed ARM averaged 2.63 percent this week with an average 0.4 point, up from last week when it averaged 2.62 percent. At this time last year, the 1-year ARM averaged 2.78 percent.
.
“Fixed mortgage rates dipped slightly while the manufacturing industry showed signs of slowing. Regionally, both the Chicago [PDF] and Milwaukee purchasing manager reports for March fell below the market consensus forecast. On a national scale, both the ISM manufacturing and non-manufacturing indexes also showed reductions in growth.”
The trend reported by Freddie Mac could continue with US Treasury yields falling today near the lows of the year helping to drive tomorrow’s lending rates lower.

Some Locations See Home Construction Double
 Central Valley Home Building Up
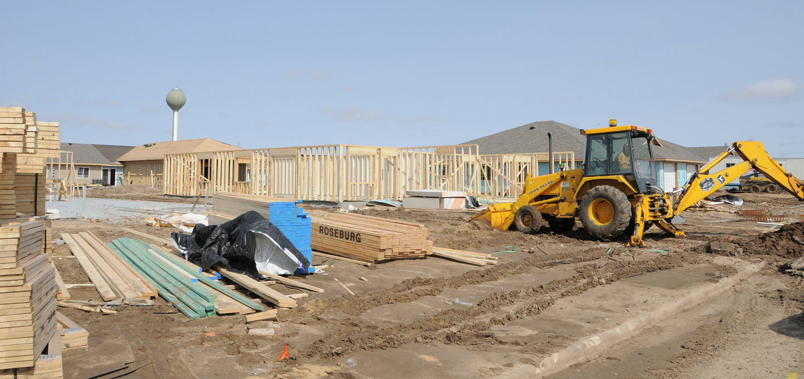
Central Valley home builders pulled permits for 587 new homes during the first three months of 2013 compared to 425 for the same period a year earlier. The figures come from Construction Monitor for Madera,Fresno,Kings and Tulare Counties.
Lennar Homes continues to lead the pack of home builders permitting 117 new homes in the region in the first quarter of the year compared to 74 for the first three months of 2012 when they were also the top builder.
Visalia new home building permits numbered 75 so far this year says the city compared just 34 for the first three months of 2012,showing the pace more than doubled. The city total building valuation is up 67% so far this year at $33.2 million compared to $19.8 million for the first quarter of 2012.
CENTRA COAST HOME PERMITS DOUBLE LAST YEAR’S PACE
Led by San Luis Obispo County the Central Coast saw new home building permits more than double in the first three months of 2013, Construction Monitor reports.
In the SLO/Santa Barbara two-county region contractors received 182 new home permits compared to 91 for the same period in 2012.
Of that, SLO County has been busier. For the first quarter of 2013 SLO County builders got permits for 123 new sf homes vs 66 for the same period in 2012. Shea Homes is the busiest builder with 32 units.
Builders also got permits for 156 units of multi-family so far this year compared to just 21 units in the first three months of 2012.

Southland Begins 2013 With Sales and Price Gains Vs. Year Earlier
 La Jolla, CA—Southern California logged the highest February home sales in six years last month amid relatively strong sales of mid- to high-end properties and a record share of homes sold to absentee buyers. The median sale price edged slightly lower from January but rose nearly 21 percent from a year earlier, marking the 11th straight month in which the median has risen year-over-year, a real estate information service reported.
A total of 15,945 new and resale houses and condos sold in Los Angeles, Riverside, San Diego, Ventura, San Bernardino and Orange counties last month. That was down 0.7 percent from 16,058 sales in January, and up 1.0 percent from 15,780 sales in February 2012, according to San Diego-based DataQuick.
Typically there’s not much change in the number of sales between January and February. On average, sales have risen 0.7 percent between those two months since 1988, when DataQuick’s statistics begin.
Last month’s sales were the highest for the month of February since 17,680 homes sold in February 2007, but they were 9.9 percent below the February average of 17,696 sales. The low for February sales was 10,777 in 2008, while the high was 26,587 in 2004.
“Our January and February stats certainly indicate housing remains a big target for investors. But typically those two months don’t offer much insight into how the market will behave the rest of the year. These are sales that closed in January and February, meaning many of the buyers were out home shopping during the holiday season late last year. That’s when many traditional buyers and sellers drop out of the market, leaving a relatively high concentration of very motivated market participants, especially investors,” said John Walsh, DataQuick president.
“March and April will offer a better view of how broader market trends are shaping up this year. One of the real wild cards will be how many more homes go up for sale. More people who’ve long been thinking of selling will be tempted to list their homes at today’s higher prices. Fewer people will be underwater and therefore could at least break even on a sale. Some investors who’ve held for a while will consider cashing in. A meaningful rise in the supply of homes on the market should at least tame price appreciation.”
The median price paid for all new and resale houses and condos sold in the six-county Southland was $320,000 last month, down 0.3 percent from $321,000 in January and up 20.9 percent from $264,750 in February 2012. The median has eased back slightly on a month-to-month basis since December’s $323,000 median, which was the highest since it was $330,000 in August 2008. The median’s year-over-year gains have been double-digit – between 10.8 percent and 23.5 percent – since last August.
“Most every gauge shows prices are up significantly over the past year, even after adjusting for changes in the types of homes selling, ” Walsh said. “But to keep today’s price levels in context, consider that last month’s median sale price was still around 37 percent below its early 2007 peak of $505,000, and it was about where the median was back in mid 2003.”
Around half of the median’s ups and downs the last five years can be attributed to shifts in the types of homes sold. Last month’s 20.9 percent year-over-year gain in the Southland median sale price reflects the combination of price appreciation as well as a shift toward more mid- to high-end sales in coastal markets and fewer sales, especially foreclosed properties, in inland areas.
Looking at a single sub-category to help adjust for this change in market mix: The median price paid for a 3-bedroom, 2-bathroom, 1,250-to-1,450-square-foot house built between 1950 and 1985 was $316,500 last month. That was down 0.2 percent from $317,000 in January, and up 13.4 percent from $279,000 in February 2012.
Move-up markets continued to show big sales gains from a year earlier. The number of homes sold in February for between $300,000 and $800,000 – a range that would include many first-time move-up buyers – rose 33.4 percent year-over-year. The number that sold for $500,000 or more jumped 54.0 percent from one year earlier, while sales of $800,000-plus homes increased 62.7 percent compared with February 2012.
Last month, 24.9 percent of all Southland home sales were for $500,000 or more, compared with a revised 22.2 percent in January and 17.4 percent in February 2012.
Sales continued to fall on a year-over-year basis in many lower-cost communities. The number of homes that sold below $200,000 in February fell 26.7 percent year-over-year, while sales below $300,000 dipped 15.4 percent. Sales in many affordable markets have been limited not by a lack of demand, but by a lack of inventory, caused largely by the slowdown in foreclosures and the relatively high percentage of owners who can’t afford to move because they owe more than their homes are worth.
Last month foreclosure resales – properties foreclosed on in the prior 12 months – accounted for 15.8 percent of the Southland resale market. That was down from a revised 17.2 percent the month before and down from 32.6 percent a year earlier. In recent months foreclosure resales have been at the lowest level since September 2007. In the current cycle, foreclosure resales hit a high of 56.7 percent in February 2009.
Short sales – transactions where the sale price fell short of what was owed on the property – made up an estimated 22.0 percent of Southland resales last month. That was down from an estimated 24.0 percent the month before and 26.9 percent a year earlier.
Investor and cash buying was at or near all-time highs.
Absentee buyers – mostly investors and some second-home purchasers – bought a record 31.4 percent of the Southland homes sold in February. That was up from 30.4 percent the prior month and up from 29.9 percent a year earlier. The monthly average since 2000, when the absentee data begin, is 17.9 percent. Last month’s absentee buyers paid a median $250,000, up 26.3 percent from a year earlier.
The share of homes that were flipped has risen, too: 6.9 percent of all homes sold on the open market last month had previously sold in the prior six months, up from a flipping rate of 6.6 percent in January and 3.7 percent in February 2012. (The figures exclude homes that were resold after being purchased at public foreclosure auction sales on the courthouse steps.)
Buyers paying with cash accounted for 35.6 percent of last month’s home sales, compared with 33.7 percent both the month before and a year earlier. The peak was 35.8 percent last December. Since 1988 the monthly average is 15.9 percent. Cash buyers paid a median $260,000 last month, up 23.8 percent from a year ago.
Credit conditions don’t appear to have changed much so far this year.
Jumbo loans, mortgages above the old conforming limit of $417,000, accounted for 21.0 percent of last month’s Southland purchase lending, up from 19.3 percent the prior month and 14.4 percent a year earlier. In the months leading up to the credit crunch that struck in August 2007, jumbos accounted for around 40 percent of the home loan market.
With fixed rates on 30-year loans so low, and aversion to risk in the marketplace high, the use of adjustable-rate mortgages (ARMs) remains very low in an historical context. Last month 5.6 percent of Southland home purchase loans were ARMs, the same as the prior month and down slightly from 5.8 percent a year earlier. Since 2000, a monthly average of about 33 percent of Southland purchase loans were ARMs.
Government-insured FHA loans, a popular low-down-payment choice among first-time buyers, accounted for 25.0 percent of all purchase mortgages last month. That was about the same as 25.1 percent the month before and down from 30.9 percent a year earlier. In recent months the FHA share has been the lowest since summer 2008. The decline reflects tighter FHA qualifying standards implemented in recent years as well as the difficulties first-time buyers are having competing with investors.
The most active lenders to Southern California home buyers last month were Wells Fargo with 8.7 percent of the market, Prospect Mortgage with 2.7 percent, and JP Morgan Chase with 2.5 percent. Bank of America, which had 2.2 percent of the Southern California market last month, recently announced that it was gearing up for a “new run” at the mortgage market. The bank had around 8 percent of the Southland market two years ago.
DataQuick monitors real estate activity nationwide and provides information to consumers, educational institutions, public agencies, lending institutions, title companies and industry analysts.
The typical monthly mortgage payment Southland buyers committed themselves to paying last month was $1,154, up from a $1,140 the month before and up from $998 a year earlier. Adjusted for inflation, last month’s typical payment was 51.1 percent below the typical payment in the spring of 1989, the peak of the prior real estate cycle. It was 60.0 percent below the current cycle’s peak in July 2007.
Indicators of market distress continue to move in different directions. Foreclosure activity remains far below peak levels. Financing with multiple mortgages is very low, and down payment sizes are stable, DataQuick reported.

What a Difference A Year Makes – Central California Home Building & Real Estate Markets Way Up
 From the Sierra to the Coast, our real estate market is on the mend with new home permits much stronger than a year ago and the value of existing homes for re-sale higher as well.
According to Construction Monitor, San Luis Obispo County reported permits for 98 new single family homes for the first two months of 2013 compared to just 50 for the same period in 2012.
Comparing the first two months of 2013 in the Central Valley town Visalia – the city reports home building permits jumped 125% over 2012 with building permits for new single family dwellings at 45 permits issued compared to 20 in 2012. Total valuation was up 107%, again due to the home building bump, to $19,772,606 for the first two months of 2013.
On a broader scale for the Central Valley counties of Madera,Fresno,Kings and Tulare combined – the region reported 328 new single family home permits for Jan /Feb 2013 compared to 243 for the same period in 2012. In Kern County sfh permits jumped from 156 to 246 in Jan/Feb 2012.
In the larger existing home market the median sales price year over year in January 2013 jumped 10.9% in Tulare County,15% in Fresno County,19.5% in Monterey and 11.7% in Santa Barbara County.SLO County numbers for January 2013 were not available through Dataquick.
Sales of new homes according to Dataquick were up double digits in most Central California counties as well. Sales in Kings County jumped from 4 to 25 year over year in January.

Lumber Prices Hit 7 Month High
From American Enterprise Institute Blog by Dr Mark Perry
Carpe Diem
As the housing sector rebounds, lumber prices reached a 7 year high today, while homebuilder stocks hit 5 year high
Mark J. Perry | January 18, 2013, 8:00 pm
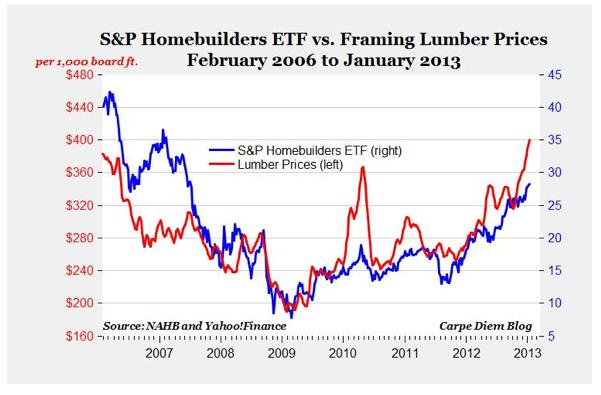
The chart above shows weekly framing lumber prices (red line), which closed today at $400 per 1,000 board feet, the highest level since September 2005, more than seven years ago. Over the last year, lumber prices have increased by 43.4%.
Meanwhile, the S&P Homebuilders ETF (blue line) closed today at 28.21, which is the highest closing price since July 2007, more than five years ago. Over the last year, the S&P Homebuilders ETF has increased by 52.7%.
Bottom Line: The chart above shows the close historical relationship between framing lumber prices and the S&P Homebuilders ETF. Now that the housing and construction sectors are rebounding, we’re also seeing that housing boom reflected in rising lumber prices.
Mark J. Perry
Dr. Mark J. Perry is a full professor of economics at the Flint campus of The University of Michigan, where he has taught undergraduate and graduate courses in economics and finance since 1996. Starting in the fall of 2009, Perry has also held a joint appointment as a scholar at The American Enterprise Institute.

Home Prices Extend Gains
 New York, January 29, 2013 – Data through November 2012, released today by S&P Dow Jones Indices forits S&P/Case-Shiller1 Home Price Indices, the leading measure of U.S. home prices, showed home prices rose 4.5% for the 10-City Composite and 5.5% for the 20-City Composite in the 12 months ending in November 2012.
In the 12 months ended in November, prices rose in 19 of the 20 cities and fell in New York. In 19 cities prices rose faster in the 12 months to November than in the 12 months to October; Cleveland prices rose at the same pace in both time periods. Phoenix led with the fastest price rise – up 22.8% in 12 months as it posted its seventh consecutive month of double-digit annual returns.
“The November monthly figures were stronger than October, with 10 cities seeing rising prices versus seven the month before.” says David M. Blitzer, Chairman of the Index Committee at S&P Dow Jones Indices.
“Phoenix and San Francisco were both up 1.4% in November followed by Minneapolis up 1.0%. On the down side, Chicago was again amongst the weakest with a drop of 1.3% for November.
“Winter is usually a weak period for housing which explains why we now see about half the cities with falling month-to-month prices compared to 20 out of 20 seeing rising prices last summer. The better annual price changes also point to seasonal weakness rather than a reversal in the housing market. Further evidence that the weakness is seasonal is seen in the seasonally adjusted figures: only New York saw prices fall on a seasonally adjusted basis while Cleveland was flat.
Regional patterns are shifting as well. The Southwest – Las Vegas and Phoenix – are staging a strong comeback with the Southeast — Miami and Tampa close behind. The sunbelt, which bore the brunt of the housing collapse, is back in a leadership position. California is also doing well while the northeast and industrial Midwest is lagging somewhat.
“Housing is clearly recovering. Prices are rising as are both new and existing home sales. Existing home sales in November were 5.0 million, highest since November 2009. New Home sales at 398,000 were the highest since June 2010. These figures confirm that housing is contributing to economic growth.
Atlanta, Denver, Las Vegas, Los Angeles, Miami, Minneapolis, Phoenix, San Diego, San Francisco and Seattle were the ten MSAs that were higher.
Year over year Los Angeles was up 7.7% San Francisco up 12.7%,San Diego up 8% and Las Vegas up 10%.

Southland Closes 2012 With Higher Sales and Prices
 January 15, 2013
La Jolla, CA—Southern California’s housing market ended 2012 with the highest December home sales in three years, the result of robust investment activity, a record level of cash buyers and more sales gains in move-up markets. The median sale price jumped nearly 20 percent from a year ago, pushed higher by greater demand and the market’s shift away from foreclosure resales and toward more mid- to high-end deals, a real estate information service reported.
A total of 20,274 new and resale houses and condos sold in Los Angeles, Riverside, San Diego, Ventura, San Bernardino and Orange counties last month. That was up 5.1 percent from 19,285 sales in November, and up 5.3 percent from 19,247 sales in December 2011, according to San Diego-based DataQuick.
A rise in sales from November to December is normal for the season. Last month’s sales were the highest for the month of December since 22,328 homes sold in December 2009, though they were 17.2 percent below the December average of 24,488 sales since 1988, when DataQuick’s statistics begin. The low for December sales was 13,240 in 2007, while the high was 36,865 in 2003.
The median price paid for a home in the six-county Southland was $323,000 last month, up 0.6 percent from $321,000 in November and up 19.6 percent from $270,000 in December 2011. For the past four consecutive months the median has been the highest since it was $330,000 in August 2008. The Southland median has risen or held steady month-to-month for 11 consecutive months and has increased year-over-year for nine consecutive months.
“The housing market had more to offer in 2012 than many anticipated. A lot of markets not only found a price bottom as foreclosures waned but they started to see their first meaningful gains in nearly two years. Buyers on the fence were drawn back into the housing game by amazingly low mortgage rates, a brighter jobs outlook and, in some cases, a renewed sense of urgency,” said John Walsh, DataQuick president.
“Last year should also be remembered as the year the move-up market awoke. If these upward trends hold, which requires a sustained economic recovery, we should eventually see more inventory hit the market. More would-be sellers will be satisfied with what their homes can fetch, and fewer people will owe more than their homes are worth, freeing them up to move. The rise in inventory would at least tame price appreciation.”
Sales rose sharply again in many mid- to-higher-cost markets in December. Home sales between $300,000 and $800,000 – a range that would include many move-up buyers – increased 31.4 percent year-over-year. December sales over $500,000 shot up 40.0 percent year-over-year, while sales over $800,000 jumped 36.3 percent compared with December 2011.
Last month 24.7 percent of all Southland home sales were for $500,000 or more, which ties the November level for the highest for any month since July 2008, when 26.1 percent of sales were for $500,000-plus. In December 2011 18.4 percent of sales crossed the $500,000 threshold.
Lower-cost areas again posted the weakest sales compared with last year. The number of homes that sold below $200,000 fell 28.1 percent year-over-year, while sales below $300,000 dipped 18.2 percent. Sales in the more affordable markets have been hampered by the slowdown in foreclosure activity, which results in fewer foreclosed properties listed for sale. Also, lower-cost markets typically have a relatively high percentage of homeowners who owe more than their homes are worth, meaning they can’t afford to sell.
While inventory and sales have declined in many of these lower-cost areas, higher demand has pushed prices up. In December, the median price paid per square foot in the lowest-cost third of Southern California’s housing stock rose 21.1 percent year-over-year, while that measure increased 11.4 percent in the middle and 13.0 percent in the top third of the market.
Last month foreclosure resales – properties foreclosed on in the prior 12 months – accounted for 14.8 percent of the Southland resale market. That was down from 15.4 percent the month before and 32.4 percent a year earlier. Last month’s level was the lowest since foreclosure resales were 13.6 percent of the resale market in September 2007. In the current cycle, foreclosure resales hit a high of 56.7 percent in February 2009.
Short sales – transactions where the sale price fell short of what was owed on the property – made up an estimated 25.6 percent of Southland resales last month. That was down slightly from an estimated 26.5 percent the month before and 26.0 percent a year earlier. However, the number (rather than percentage) of short sales last month was up 7.4 percent from December 2011.
Last month investor and cash buying was at or near record levels.
Absentee buyers – mostly investors and some second-home purchasers – bought 29.1 percent of the Southland homes sold in December. That was up from 28.6 percent the prior month and 26.8 percent a year earlier. Last month’s figure was the highest since the absentee share of sales was a record 29.9 percent last February. The monthly average since 2000 is 17.7 percent. Last month’s absentee buyers paid a median $252,750, up 24.8 percent from a year earlier.
Buyers paying with cash accounted for a record 33.8 percent of last month’s home sales, tying a revised 33.8 percent the month before and up from 29.8 percent a year earlier. The prior peak for cash purchases was 33.7 percent of all sales last February, and since 2000 the monthly average is 17.3 percent. Cash buyers paid a median $265,000 last month, up 26.2 percent from a year ago.
The number of Southland homes cash buyers bought for $500,000 or more has hovered near record levels in recent months, reflecting difficulties many face in qualifying for larger loans as well as some people’s desire to park cash in real estate amid today’s low-interest-rate savings environment.
In December, cash buyers bought 1,309 homes priced $500,000 or more, up 49.6 percent from a year earlier. Last month’s $500,000-plus cash purchases represented more than one quarter of all homes sold at that price level. About 40 percent of the people who paid $500,000-plus in cash for a home were absentee buyers last month, which typically means they are investors or second-home buyers.
Meantime, credit conditions showed modest signs of improvement.
Jumbo loans, mortgages above the old conforming limit of $417,000, accounted for 22.3 percent of last month’s Southland purchase lending, up from 21.2 percent the prior month and up from 15.3 percent a year earlier. Last month’s figure was the highest since September 2007, when jumbos made up 26.9 percent of the purchase loan market. In the months leading up to the credit crunch that struck in August 2007, jumbos made up close to 40 percent of the market.
With rates on fixed 30-year loans so low, and aversion to risk in the marketplace high, the use of adjustable-rate mortgages (ARMs) remains very low in an historical context. Last month 5.9 percent of Southland home purchase loans were ARMs, compared with 5.6 percent in November and 6.4 percent a year earlier. Since 2000, a monthly average of about 33 percent of Southland purchase loans were ARMs.
Government-insured FHA loans, a popular low-down-payment choice among first-time buyers, accounted for 23.2 percent of all purchase mortgages last month. That was down from 24.6 percent in November and down from 30.5 percent a year earlier. In recent months the FHA share has been the lowest since summer 2008. The decline reflects tighter FHA qualifying standards implemented in recent years as well as the difficulties first-time buyers are having competing with investors in the housing market.
The most active lenders to Southland home buyers last month were Wells Fargo with 8.9 percent of the market, Prospect Mortgage with 2.6 percent and IMortgage.com with 2.4 percent.
DataQuick monitors real estate activity nationwide and provides information to consumers, educational institutions, public agencies, lending institutions, title companies and industry analysts.
The typical monthly mortgage payment Southland buyers committed themselves to paying last month was $1,152, up from a revised $1,132 the month before and up from $1,026 a year earlier. Adjusted for inflation, last month’s typical payment was 51.2 percent below the typical payment in the spring of 1989, the peak of the prior real estate cycle. It was 60.0 percent below the current cycle’s peak in July 2007.
Indicators of market distress continue to move in different directions. Foreclosure activity, while above long-term averages, continues to drop and is far below peak levels. Financing with multiple mortgages is very low, and down payment sizes are stable, DataQuick reported.