Key Downtown Visalia Office Building Changes Hands


5-story medical building next to Downtown Visalia Kaweah Delta campus

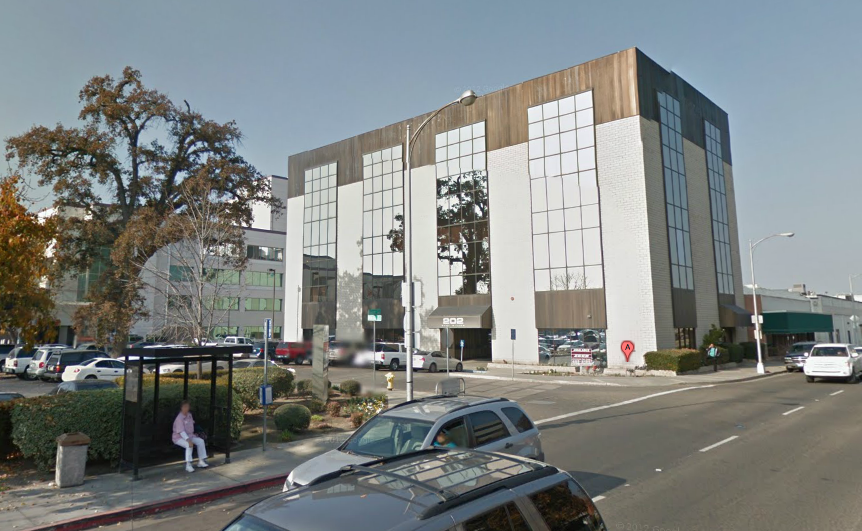
The hospital wanted it but a Tulare dentist and his father ended up buying it. We’re talking about 202 West Willow, the five-story medical building  adjacent the Kaweah Delta campus. Built by Dr Bernie Rudis in 1981 the big building did not meet earthquake standards and ended up in the lenders hands before it was remodeled in the 1990s.Remember when American National Bank‘s branch was there?

It was then purchased by an investment group but was never fully upgraded to Class A medical office standards say sources. Now the building has been purchased by Dr. Sarjit S. Malli who is said to be interested in upgrading the 30 year old skyscraper. “We’re happy Dr. Malli ended up with it” says the hospital’s CEO Lindsay Mann adding he understands Dr Malli would like to attract new physicians to the building at the doorstep to Downtown’s big medical complex. The sale was said to be north of $5 million.Dr Malli did not return phone calls.

HOME PRICES REBOUND ACCELERATES IN NOVEMBER – Asking-Price Gains In Sacramento / Inland Empire

SAN FRANCISCO, December 4, 2012 – Trulia today released the latest findings from the Trulia Price Monitor and the Trulia Rent Monitor, the earliest leading indicators available of trends in home prices and rents. Based on the for-sale homes and rentals listed on Trulia, these monitors take into account changes in the mix of listed homes and reflect trends in prices and rents for similar homes in similar neighborhoods through November 30, 2012.

Asking Prices Up 3.8 Percent Year-over-Year Nationally 
In November, asking home prices rose 0.8 percent month-over-month (M-o-M), seasonally adjusted–which implies an annualized growth rate of 10 percent. Year-over-year (Y-o-Y) prices increased 3.8 percent, which was also the largest yearly increase to date. Quarter-over-quarter (Q-o-Q) prices rose 2.2 percent, seasonally adjusted, another post-crisis high; in fact, prices rose 0.8 percent Q-o-Q without adjusting for seasonality, even though prices typically decline after summer.
Home Prices in Hard-Hit Atlanta, Sacramento, and the Inland Empire Now Bouncing Back
For the first time since the housing crisis began, Atlanta and two inland California metros—Riverside-San Bernardino and Sacramento—all experienced significantly large Q-o-Q asking home price gains. Unlike other hard-hit metros such as Phoenix, Las Vegas, and Miami, prices in these metros have been slower to bounce back, declining in February and making smaller gains in August and May.

Other metros experiencing large quarterly increases in November include Salt Lake City and Wilmington, DE, both of which surpassed 7 percent, along with, Cape Coral – Fort Myers, FL, San Jose, Portland, OR, and Denver.

Rents Rose 5.6 Percent Year-over-Year, But Prices Catching Up in Largest Markets
Nationally, rents rose 5.6 percent Y-o-Y, outpacing the national price gain of 3.8 percent. However, asking prices in 14 of the 25 largest rental markets actually rose faster than rents as the price recovery picks up. In fact, prices have zoomed ahead of fast-rising rents in Denver, Seattle, and San Francisco, which rank among the top 10 metros where rents rose most in November.

Record Low Mortgage Rates Boost Sales

Mortgage Rates Dip To New Record Lows
MCLEAN, Va., Nov. 15, 2012 Freddie Mac  released the results of its latest survey, showing fixed mortgage rates dipping to new all-time record lows amid indicators of higher consumer confidence and lower wholesale prices. The previous record low for the 30-year fixed was set the week of October 4, when it averaged 3.36 percent, and the 15-year fixed was set the week of October 18, when it averaged 2.66 percent.
30-year fixed-rate mortgage (FRM) averaged 3.34 percent with an average 0.7 point for the week ending November 15, 2012, down from last week when it averaged 3.40 percent. Last year at this time, the 30-year FRM averaged 4.00 percent.
15-year FRM this week averaged 2.65 percent with an average 0.7 point, down from last week when it averaged 2.69 percent. A year ago at this time, the 15-year FRM averaged 3.31 percent.
5-year Treasury-indexed hybrid adjustable-rate mortgage (ARM) averaged 2.74 percent this week with an average 0.6 point, up from last week when it averaged 2.73 percent. A year ago, the 5-year ARM averaged 2.97 percent.
1-year Treasury-indexed ARM averaged 2.55 percent this week with an average 0.3 point, down from last week when it averaged 2.59 percent. At this time last year, the 1-year ARM averaged 2.98 percent.

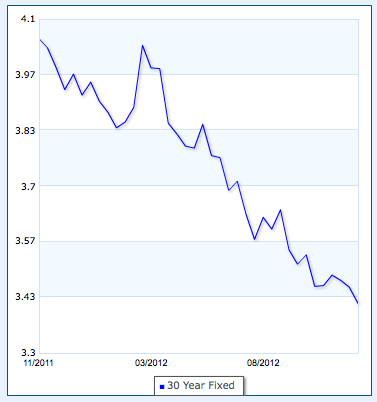
Bankrate 1 year mortgage rates

The average single family home mortgage rate is down from 4% a year ago to 3.41% (compared to 3.34% in Freddie Mac survey) this week says Bankrate (see chart).

October Home Sales In S2S Region

California’s central region saw an increase in median prices from year ago in October and sales volume was mixed according to DQ News.

In San Luis Obispo County sales of resale homes were up 23% year over year and the median price increased 5.6%. Santa Barbara County showed an even more remarkable turnaround with sales up 17.6% and  the median up 42%. SLO County showed a recovery in the condo market with sales up 34.5%  and a 50% jump in median prices to $300,000 from $200,000 in October 2011.

In the Valley, Fresno saw a sales increase of 12.5% and median was up 3.9%. In Tulare County sales were down 4.9% and the median was up 14.4% to $133,000.

Southland Home Sales Up 18%, Median Price Up 17%

November 13, 2012

La Jolla, CA—Southern California home sales rose sharply in October as move-up buyers joined investors, shifting the mix of homes selling up a notch as foreclosure resales hit a five-year low. The median price paid for a home rose nearly 17 percent from a year earlier, a real estate information service reported.

A total of 21,075 new and resale houses and condos sold in Los Angeles, Riverside, San Diego, Ventura, San Bernardino and Orange counties last month. That was up 18.0 percent from 17,859 sales in September, and up 25.2 percent from 16,829 sales in October 2011, according to San Diego-based DataQuick.

Last month’s sales were the highest for the month of October since 22,132 homes sold in October 2009, though they were 11.1 percent below the October average of 23,709 since 1988, when DataQuick’s statistics begin. The low for October sales was 12,913 in 2007, while the high was 37,642 in 2003.

The median price paid for a home in the six-county Southland was $315,000 last month, the same as in September and up 16.7 percent from $270,000 in October 2011. The September and October medians are the highest since the median was $330,000 in August 2008. The Southland median has risen or held steady month-to-month for nine consecutive months and has increased year-over-year for the past seven months.

The median price and other price measures are rising mainly for two reasons: First, higher demand, triggered largely by ultra-low mortgage rates, has coincided with a dwindling supply of homes for sale, which pushes prices up. Second, this year there’s been a big change in the types of homes selling: Discounted foreclosures are a smaller share of sales, while move-up homes are a larger share, which puts upward pressure on the median price.

“Watching the market rebalance itself is fascinating. In some categories and in some neighborhoods, demand outstrips supply, pushing up prices. In other areas, the market is still largely dormant. Low interest rates are a huge factor, where mortgages are available, which they aren’t for a lot of potential buyers,” said John Walsh, DataQuick president.

The Southland’s lower-cost areas continued to post the weakest sales compared with last year. The number of homes that sold below $200,000 fell 11.2 percent year-over-year, while sales below $300,000 dipped 0.3 percent. Sales in these more affordable markets have been hampered by the slowdown in foreclosure activity, which results in fewer foreclosed properties listed for sale, as well as the high percentage of homeowners who still owe more than their homes are worth, meaning they can’t sell and move on.

While inventory and sales have declined in many of these lower-cost areas, higher demand has pushed prices up. In October, price levels for the lowest-cost third of Southern California’s housing stock rose 17.0 percent year-over-year, while they rose 6.2 percent in the middle and 8.1 percent in the top third.

Sales rose sharply in most mid- to-higher-cost markets in October. Sales between $300,000 and $800,000 – a range that would include many move-up buyers – jumped 41.5 percent year-over-year. October sales over $500,000 rose 55.2 percent year-over-year, while sales over $800,000 rose 52.4 percent compared with October 2011.

Last month 23.3 percent of all Southland sales were for $500,000 or more, down slightly from 23.9 percent in September, which was a four-year high, and up from 17.9 percent a year earlier.

Foreclosure resales – properties foreclosed on in the prior 12 months – accounted for 16.3 percent of the Southland resale market last month. That was down from 16.6 percent the month before and 32.8 percent a year earlier. Last month’s level was the lowest since it was 16.0 percent in October 2007. In the current cycle, the foreclosure resales hit a high of 56.7 percent in February 2009.

Short sales – transactions where the sale price fell short of what was owed on the property – made up an estimated 26.0 percent of Southland resales last month. That was down slightly from an estimated 27.6 percent the month before and up from 25.4 percent a year earlier.

Credit conditions didn’t appear to change much in October, though the share of purchase loans that were “jumbo” hovered near a five-year high.

Jumbo loans, mortgages above the old conforming limit of $417,000, accounted for 21.1 percent of last month’s purchase lending, down a hair from 21.4 percent the prior month and up from 14.6 percent a year earlier. In recent months the jumbo share has been the highest since December 2007, when jumbos made up 21.7 percent of the purchase loan market. In the months leading up to the credit crunch that struck in August 2007, jumbos made up close to 40 percent of the market.

With interest rates on fixed 30-year loans so low, and aversion to risk in the marketplace so high, the use of adjustable-rate mortgages (ARMs) remains extraordinarily low in an historical context. Last month 6.0 percent of Southland home purchase loans were ARMs, compared with 5.8 percent in September and 6.9 percent a year earlier. Since 2000, a monthly average of about 33.1 percent of Southland purchase loans were ARMs.

The most active lenders to Southland home buyers last month were Wells Fargo with 8.4 percent of the market, IMortgage.com with 2.6 percent and Prospect Mortgage with 2.4 percent.

Investors continue to account for an unusually large share of all sales.

Absentee buyers – mostly investors and some second-home purchasers – bought a near-record 28.0 percent of the Southland homes sold last month. That was up from 27.7 percent the prior month and up from 25.4 percent a year earlier. The record was 29.9 percent in February this year, while the monthly average since 2000 is 17.6 percent. Last month’s absentee buyers paid a median $245,000, up 22.5 percent from a year earlier.

Buyers paying with cash accounted for a near-record 32.1 percent of October home sales, down insignificantly from 32.2 percent the month before and up from 30.0 percent a year earlier. Cash purchases peaked at 33.7 percent of all sales this February, and since 2000 the monthly average is 16.8 percent. Cash buyers paid a median $250,000 last month, up 21.1 percent from a year ago.

Home flipping edged higher again. Last month 6.1 percent of all homes sold had sold twice on the open market within a six-month period, up from 5.5 percent in September and 3.7 percent a year earlier.

Government-insured FHA loans, a popular low-down-payment choice among first-time buyers, fell to a more-than-four-year low in terms of their share of all purchase lending. Last month FHA loans accounted for 25.2 percent of all purchase mortgages, down from 25.5 percent the month before and 31.9 percent a year earlier. The October FHA share was the lowest since July 2008, when it was 24.4 percent. The declining market share for FHA loans reflects tighter qualifying standards implemented in recent years as well as the difficulties first-time buyers are having competing with investors.

DataQuick monitors real estate activity nationwide and provides information to consumers, educational institutions, public agencies, lending institutions, title companies and industry analysts.

The typical monthly mortgage payment Southland buyers committed themselves to paying last month was $1,115, down from $1,127 the month before and up from $1,040 a year earlier. Adjusted for inflation, last month’s typical payment was 53.1 percent below the typical payment in the spring of 1989, the peak of the prior real estate cycle. It was 61.6 percent below the current cycle’s peak in July 2007.

Indicators of market distress continue to move in different directions. Foreclosure activity, while above long-term averages, continues to drop and is far below peak levels. Financing with multiple mortgages is very low, and down payment sizes are stable, DataQuick reported.

Dual Income Couples Fueling Housing Market

ORLANDO (November 10, 2012) – Dual income households are comprising a greater portion of the housing market and helping sales recover, according to an annual study released today.

The 2012 National Association of Realtors® Profile of Home Buyers and Sellers continues a long-running series of large national NAR surveys evaluating the demographics, preferences, motivations, plans and experiences of recent home buyers and sellers.  The responses are heavily representative of owner-occupants and do not include most investors.

Sixty-five percent of all buyers are married couples, 16 percent are single women, 9 percent single men, 8 percent unmarried couples and 2 percent other; percentages of single buyers were slightly higher in 2011. However, just two years ago, 58 percent of buyers were married, 20 percent were single women, 12 percent single men and 7 percent unmarried couples; the overall market share of single buyers declined a total of 7 percentage points over the past two years.  Before 2010, the market shares moved within a very narrow range, generally a percentage point or two.

Paul Bishop, NAR vice president of research, said the study is painting a clearer picture of the impact of mortgage limitations.  “We’ve known for some time that stringent mortgage credit standards have been holding back home sales, but these findings show single buyers have been hurt the most over the past two years.  Total home sales would be 10 to 15 percent higher without these unnecessary headwinds,” he said.

“The continued growth in married couples as single buyers shrink demonstrates that households with dual incomes are more successful in obtaining a mortgage.  However, given the historically favorable housing affordability conditions, most single-income buyers could also purchase a home and stay well within their means, if lending requirements were more sensible,” Bishop said.

First-time home buyers* edged up to a 39 percent market share in the past year from 37 percent in the 2011 study.  Long-term survey averages show that four out of 10 buyers are typically first-time buyers, who are critical to a housing recovery because they help existing home owners to sell and make a trade.

The study shows the median age of first-time buyers was 31 and the median income was $61,800.  The typical first-time buyer purchased a 1,600 square-foot home costing $154,100, while the typical repeat buyer was 51 years old and earned $93,100.  Repeat buyers purchased a median 2,100-square foot home costing $220,000.

The median downpayment for all home buyers was 9 percent, ranging from 4 percent for first-time buyers to 13 percent for repeat buyers. “First-time buyers historically make small downpayments, but repeat buyers like to put down 20 percent if they can to avoid paying mortgage

KELLER WILLIAMS LAUNCHES COMMERCIAL REAL ESTATE DIVISION IN TULARE/KINGS COUNTIES


Kevin Land

Keller Williams Realty is expanding its operations in Tulare and Kings Counties by launching a commercial real estate division. The launch of this division will allow Keller Williams to become a more diversified real estate company to meet the needs of all current and future clients.

Keller Williams Realty – Tulare and Kings County Chief Executive Officer Brian Icenhower said the launch comes at a great time because the commercial market is showing signs of rebounding in the South Valley, there is an eager workforce, existing business incentives, and great communities.

Icenhower said one important component of launching the commercial department was hiring the right person to lead the division.  Kevin Land, a Tulare County native, is the new director of the commercial real estate division for Tulare and Kings County. Land has specialized in commercial real estate for the last 8 years with CBRE/CB Richard Ellis in Fresno. 

 “I’m excited to come back to Tulare County and serve my community by helping clients expand and relocate their businesses in this region,” Land said.

Icenhower said Keller Williams is excited to welcome Kevin to its team.

“Kevin has already shown the dedication to grow the commercial division and has become a huge asset to the company in a short amount of time,” Icenhower said.

Land earned a business degree in Real Estate/Land Economics from CSU, Fresno’s Sid Craig School of Business in 2005.

KW Commercial is the 6th largest real estate company in the nation. KW Kings & Tulare Counties is Central Southern California’s largest and highest producing real estate company with offices in Visalia, Tulare, Porterville and Hanford. For more information, visit Keller Williams Realty online at kwtularecounty.com I (559) 733-4100.

California Foreclosure Activity Lowest Since Early 2007…SLO COUNTY DROPS 50%

La Jolla, CA.–Three and a half years after peaking, the number of California homes entering the foreclosure process fell last quarter to the lowest level since the early stages of the housing bust. Mortgage default filings hit their lowest point since first-quarter 2007, due in large part to a stronger economy and housing market and more short sales, a real estate information service reported.
A total of 49,026 Notices of Default (NoD) were recorded on residential properties during the third quarter. That was down 10.2 percent from 54,615 for the prior three months, and down 31.2 percent from 71,275 in third-quarter 2011, according to San Diego-based DataQuick.
SLO Down 50%
In our reading area San Luis Obispo County foreclosures are down a whopping 50% for the  third quarter dropping from 246 to 123 year over year.
Central Valley Counties Down 33%
In Tulare County and other Central Valley counties where the foreclosures have been much higher the trend is the same with Notices of Default down from 866 for the 3rd quarter of 2011 to 636, a 27% reduction. Overall the numbers in the Central Valley dropped 33%.
Booming Bay Area counties like Marin were down 58%, Santa Clara was down 54%.
Even beat up Fresno registered a big drop of 41%.

Down Two Thirds Since Peak
Last quarter’s number was the lowest since 46,760 NoDs were recorded in first-quarter 2007. NoDs peaked in first-quarter 2009 at 135,431. DataQuick’s NoD statistics go back to 1992.
“A foreclosure happens when a homeowner owes more on the property than the property’s worth. Otherwise it could be sold and the mortgage paid off. So foreclosures go up when home values go down. Prices in most areas today are up significantly from their low point in early 2009,” said John Walsh, DataQuick president.
“Additionally, during the past year, we’ve seen short sales overtake the foreclosure process as the procedure of choice to deal with homeowner distress. That may change after New Year’s because the temporary ‘debt forgiveness” feature in the tax code is set to expire as part of the so-called ‘fiscal cliff’,” he said.
The median price paid for a California home last quarter was $300,000, which was 32.2 percent off the $227,000 bottom in first-quarter 2009, DataQuick reported.
Short sales – transactions where the sale price fell short of what was owed on the property – made up an estimated 26.0 percent of statewide resale activity last quarter. That was up from an estimated 24.0 percent the prior quarter and up from 22.9 percent of all resales a year earlier. The estimated number of short sales last quarter rose 19.0 percent from a year earlier.
Foreclosure resales accounted for 20.0 percent of all California resale activity last quarter, down from a revised 27.8 percent the prior quarter and 34.2 percent a year ago. The figure peaked at 57.8 percent in the first quarter of 2009. The level of foreclosure resales – homes foreclosed on in the prior 12 months – varied significantly by county last quarter, from 5.5 percent in San Francisco County to 35.5 percent in Sutter County.
NoD filings fell last quarter across all home price categories. But mortgage defaults remained far more concentrated in California’s most affordable neighborhoods. Zip codes with third-quarter 2012 median sale prices below $200,000 collectively saw about 8 NoDs filed for every 1,000 homes in those zip codes, while the ratio was about 5 NoDs filed per 1,000 homes for zip codes with $200,000 to $800,000 medians. For the group of zip codes with median sale prices above $800,000, there were just under 2 NoDs filed per 1,000 homes.
Most of the loans going into default are still from the 2005-2007 period: the median origination quarter for defaulted loans is still third-quarter 2006. That has been the case for three years, indicating that weak underwriting standards peaked then.
The most active “beneficiaries” in the formal foreclosure process last quarter were Bank of America (8,061), JP Morgan Chase(6,713) and Wells Fargo (5,780).
The trustees who pursued the highest number of defaults last quarter were ReconTrust Co (mostly for Bank of America and Bank of New York), Quality Loan Service Corp (Bank of America) and NDEx West (Wells Fargo).
On primary mortgages, California homeowners were a median eight months behind on their payments when the lender filed the Notice of Default. The borrowers owed a median $16,414 on a median $315,000 mortgage.
On home equity loans and lines of credit in default, borrowers owed a median $4,779 on a median $78,804 credit line. The amount of the credit line that was actually in use cannot be determined from public records.
San Diego-based DataQuick monitors real estate activity nationwide and provides information to consumers, educational institutions, public agencies, lending institutions, title companies and industry analysts. Notices of Default are recorded at county recorders offices and mark the first step of the formal foreclosure process.
Although 49,026 default notices were filed last quarter, they involved 48,257 homes because some borrowers were in default on multiple loans (e.g. a primary mortgage and a line of credit).
Of the state’s larger counties, mortgages were least likely to go into default in San Francisco, San Mateo and Santa Clara counties. The probability was highest in Madera, Riverside and Yuba counties.
On average, homes foreclosed on last quarter took 7.9 months to wind their way through the formal foreclosure process, beginning with an NoD. That’s up a tad from an average of 7.7 months the prior quarter and down from 9.9 months a year earlier.
Trustees Deeds recorded (TDs), or the finalized loss of a home to the formal foreclosure process, totaled 22,949 during the third quarter. That was up 5.0 percent from 21,851 for the prior quarter, and down 41.0 percent from 38,895 for third-quarter 2011. The all-time peak was 79,511 in third-quarter 2008. The state’s all-time low was 637 in the second quarter of 2005, DataQuick reported.
Just as with mortgage default filings, foreclosures remained far more concentrated in the state’s most affordable neighborhoods. Zip codes with third-quarter 2012 median sale prices below $200,000 collectively saw 4.8 homes foreclosed on for every 1,000 homes in existence. That compares with 2.0 foreclosures per 1,000 homes for zip codes with medians from $200,000 to $800,000, and less than one foreclosure per 2,000 homes in the group of zip codes with over-$800,000 medians.
While 1.48 million of California’s roughly 8.71 million houses and condos have been involved in a foreclosure proceeding the past five years, 847,067 have gone through the whole foreclosure process. The other 633,000 were either sold, or the payments were brought current.
At formal foreclosure auctions held statewide last quarter, an estimated 39.4 percent of the foreclosed properties were bought by investors or others who don’t appear to be lender or government entities. That was up from an estimated 39.2 percent the previous quarter and up from 31.0 percent a year earlier, DataQuick reported.
UCLA Anderson Forecast Predicts Slow Growth This Year / Faster Growth Expected by 2014

Los Angeles, September 20, 2012 – The UCLA Anderson Forecast says that Gross Domestic Product (GDP) growth in the U.S. will remain tepid throughout 2012. In its third quarterly report of 2012, the Forecast expects to see 1.3% growth for the third quarter of this year and 1.5% growth in the fourth. In 2013, the outlook is for growth above 2%, but 2014 “could very well put the run rate of GDP growth in excess of 3%, as economic activity is buoyed by strength in residential and nonresidential construction and a rebound in export growth.”

In California, the current forecast reflects the national forecast with continued, but slightly slower gains in employment through 2012, with faster-paced growth throughout the forecast period, which runs through 2014. This uptick in growth will result in a breakthrough to single-digit unemployment.

In his September Forecast report, UCLA Anderson Forecast Senior Economist David Shulman labels current conditions in the U.S. as “the muddle through economy,” noting that the economy continues to limp along at a very sluggish pace as it has since the low point of the “Great Recession” in mid-2009. Shulman notes that real GDP growth has been in the 1-3% channel and is now operating at the lower end of that range.

Shulman says this tepid growth, combined with a structural adjustment in the economy, has caused employment gains to be modest, resulting in an unemployment rate above 8% for three and a half years. “With several quarters of 1-2% growth ahead of us we do not expect the unemployment rate to dip below 8% on a quarterly basis until the first quarter of 2014,” writes Shulman. “Simply put, job growth on the order of 160,000 a month in 2013 will not be sufficient to make any real dent in the unemployment rate. However, as job growth accelerates to 200,000 a month in 2014, the unemployment rate will begin to meaningfully improve.”

Shulman’s optimism about 2013 and 2014 is buoyed by what he calls “the lone bright spot in the economy,” the long awaited rebound in housing construction. “Led by multi-family construction, housing starts are ramping up from 612,000 units in 2011 to 763,000 units this year and just under one million units in 2013. By 2014, we anticipate that housing starts will be in excess of 1.3 million units (and) the growth in housing will account for about a full percentage point in GDP growth by 2014.” Shulman says the strength in housing is underpinned by gradually rising home prices, record low mortgage rates, improved household formations and modest employment growth.

On the flip side, Shulman warns that if Congress and the President fail to agree to an end of year compromise on taxes and spending, the economy could fall off the “fiscal cliff”, leading to a downturn in 2013.

The California Forecast

In the California report, Senior Economist Jerry Nickelsburg examines how California’s exports and their volumes affect employment growth in the state. After establishing that exports are an important part of the California economy (if exports of goods were an independent sector, it would be one of the state’s top five), Nickelsburg’s analysis reveals that “while California’s exposure to the international economy is substantial, the sensitivity of the California economy to international risk is only marginally above the national risk.”

The current California forecast calls for the state’s unemployment rate to be at 7.9% and within 0.4% of the U.S. rate by the end of the forecast period. The forecast for 2012 calls for employment growth of 1.8%, 1.6% and 2.4% in 2012, 2013 and 2014 respectively. Payrolls will grow more steadily at 1.7%, 1.5% and 2.3% for the three forecast years. The unemployment rate will hover around 10.7% through 2012 and average 9.8% throughout 2013. In 2014, the forecast says the unemployment rate will drop to 8.5%, just shy of a percent higher than in the U.S.

California Home Sales Down But Median Price Hits 4-Year High

LOS ANGELES (Sept. 17) – California home sales declined in August but continued to maintain a strong pace, recording five consecutive months of year-over-year sales gains, while the median price reached a four-year high, the CALIFORNIA ASSOCIATION OF REALTORS® (C.A.R.) reported.
“A lack of inventory remains an issue, as the housing supply fell more than 30 percent from last year,” said C.A.R. President LeFrancis Arnold.  “Inventory levels are at the lowest levels we’ve seen in seven years, and we are starting to see the supply shortage conditions having a negative impact on sales in the Central Valley and the Inland Empire, where REO properties are in short supply.” 
 
August marked the fifth consecutive month that sales were higher than the previous year, with closed escrow sales of existing, single-family detached homes in California totaling a seasonally adjusted annualized rate of 511,240 units, according to information collected by C.A.R. from more than 90 local REALTOR® associations and MLSs statewide.  Sales in August were down 3.4 percent from a revised 529,430 in July but up 2.3 percent from a revised 499,880 in August 2011.  The statewide sales figure represents what would be the total number of homes sold during 2012 if sales maintained the August pace throughout the year.  It is adjusted to account for seasonal factors that typically influence home sales.
The statewide median price of an existing, single-family detached home rose 3 percent to $343,820 in August, up from July’s $333,860 median price.  The August figure was up 15.5 percent from a revised $297,660 recorded in August 2011, marking the sixth consecutive month of both month-to-month and year-to-year price increases.  August’s median price was the highest since August 2008, when the median price was $352,730.  The year-to-year increase was the largest in more than two years.
“The median price is gaining in part because of a shift in the mix of what is selling. The increasing share of sales in higher-priced coastal markets at the expense of the inventory-scarce distressed markets has been the primary factor in fueling the statewide median price,” said C.A.R. Vice President and Chief Economist Leslie Appleton-Young.  “While higher-priced markets with a robust economy are experiencing a strong demand in equity sales and posting double-digit year-over-year price increases, sales in lower-priced markets that rely more on distressed properties were stagnant or even declined, as the inventory of REO properties continues to wane.”

Local Numbers
In the S2S reading area the San Luis Obispo  county median was $386,180, down from $423,530 in July but up from $352,310 in August 2011,a 9.6% increase year over year. Sales year over year were up 1%.
In Fresno County the median was $151,110 in Aug 2012 up from $141,050 in Aug 2011.Year over year sales were down 10.4% but up 4.7% from July 2012.
InTulare County the median was $130,800 – up  7.4% since July 2012 and up 4.9% year over year. sales were up10.5% since July but down 1.7% year over year.
Other key facts of C.A.R.’s August 2012 resale housing report include:
• California’s housing inventory continued its downward trend in August, with the Unsold Inventory Index for existing, single-family detached homes declining to 3.2 months, down from a revised 3.5 months in July and a revised 5.2 months in August 2011.  The index indicates the number of months needed to sell the supply of homes on the market at the current sales rate.  A six- to seven-month supply is considered normal.
• Interest rates edged up slightly in August after four consecutive months of decreases.  Thirty-year fixed-mortgage interest rates averaged 3.60 percent during August 2012, up from 3.55 percent in July, but down from 4.27 percent in August 2011, according to Freddie Mac.  Adjustable-mortgage interest rates edged down in August, averaging 2.67 percent, down from 2.69 percent in July and down from 2.93 percent in August 2011. 
• Homes moved faster on the market in August, with the median number of days it took to sell a single-family home falling to 41.1 days in August 2012 from 43.2 days in July and down from a revised 52.5 days for the same period a year ago.

Some Spark of Life For Visalia Housing Market

Visalia has been the poster-child for the nationwide housing crunch, caught up in the speculative run-up in prices and expansive overbuilding by a flotilla of national and area builders that led to the bleak economic picture we have all seen, the banking and Wall Street collapse,our economies shrinking and the rest.

The nationwide economic downturn has been well on display in Visalia where the average house has lost more than half its value, a sea of foreclosures and resulted in the departure of most of the homebuilders from the market.

Last year was a decade-low year for homebuilding with the city permitting only 181 single family homes – down from the height of the building frenzy when Visalia permitted 1450 new homes in 2005.

That’s why this August home permits just tabulated by the city, look impressive. The city permitted 55 new single family homes in August bringing this years’ total so far to 181, the same number permitted for all of last year.

“We’ve seen several builders say business has picked up” says Greg Adams, Visalia’s chief building official.”It’s a steady pace and it is all around town.”

“We understand Pulte Homes is bringing in permits for about 20 more in September” adds Adams.

“I think the difference is that the homebuilders are no longer building on spec. These are pre-sold homes.”

Among the busiest builders is national builder Lennar Homes who is now number one in sales in the Central Valley.

While the inventory of existing homes continues to fall – the price of homes has been going up across the nation – up 3.8% in July CoreLogic reported this week.

“It’s been six years since the housing market last experienced the gains that we saw in July, with indications the summer will finish up on a strong note,” said Anand Nallathambi, president and CEO of CoreLogic. “Although we expect some slowing in price gains over the balance of 2012, we are clearly seeing the light at the end of a very long tunnel.”

Record low mortgage rates are not hurting either and a recent rate rise may have people finally getting off the fence. Lennar says there are other factors. Pent up demand from crowded households are leading to new customers. In their second quarter 2012 report Lennar says their backlog of 3,970 homes is up 61% from Q2 2011 and their revenues of $930.2 million is up 22% from Q2 2011.

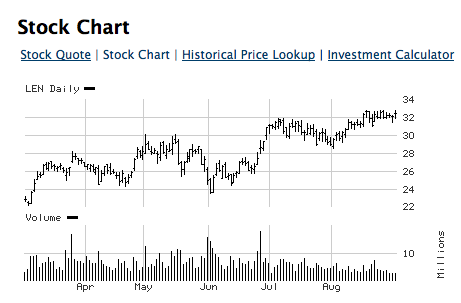
Florida-based Lennar’s stock value has improved this year rising by a third since earlier this year.

Lennar has three subdivisions in Visalia with prices starting as low as $189,000. The average new home inVisalia is being permitted at around $200,000. Attractive mortgage rates right now show paying a $180,000 mortgage for 30 years is around $860 per month, about the same as renting.

Helping the new home market has been a decline in existing home inventory seen across the state. A recent Redfin survey found homeowners holding off putting their houses up for sale figuring it will fetch more later. Instead, they are renting out their house. “We believe the main problem is not, as conventional wisdom would have it, that people can’t sell because they’re underwater on their mortgage. The problem with sales volume is that most homeowners just don’t want to sell.” says Redfin CEO  Glenn Kelman.

For buyers facing fewer used home choices on the market – why not go for new home?

Local home builder Gary Smee agrees that demand has improved. “Our traffic has picked up” says Smee who has subdivisions in Porterville and Goshen. “With the low inventory out there people are willing to pay more but the appraisals are behind.That’s what is holding things up.”

Smee says he believes it will take some time for the appraisals to  reach what buyers are willing to pay for.

Smee says in Porterville he is only builder left doing new homes in any number with Woodard Homes gone and Ennis doing only a few after their bankruptcy.