Biz Updates: Rail Rumbles / Tulare Is Low Price Leader For Gasoline / Visalia Building Permits Climb

Visalia Home Building Permits Stay Strong

New home building permits in Visalia stayed strong in November with permits for 34 homes issued.That compares to 23 for November 2012. Year to date the number of new home building permits climbed 52% over last year and valuation has jumped by 84%. The total valuation of all types of permits in Visalia has increased 44% this year so far.

For the entire year it is likely the city will permit just under 400 new homes  – about the pace seen in 2009 as the US started to slip into the recession. The year 2012 was the low with 252 homes permitted all year.

Weekly Rail Traffic Up 26%

Here’s a good economic indicator! The Association of American Railroads reported increased U.S. rail traffic for the week ending Nov. 23, 2013, with 296,581 total carloads, up 17.4 percent compared with the same week last year, which was Thanksgiving week in 2012. Total U.S. weekly intermodal volume was 267,759 trailers and containers, up 37.7 percent compared with the same week last year.  Total combined U.S. weekly rail traffic was 564,340 carloads and intermodal units, up 26.2 percent compared with the same week last year.

All 10 of the carload commodity groups tracked by AAR on a weekly basis posted increases compared with the same week in 2012, led by motor vehicles and parts with 18,075 carloads, up 42.2 percent and nonmetallic minerals and products with 34,048 carloads, up 40.3 percent.

Screen shot 2012-06-09 at 7.35.08 AMTulare County Gas Price Is State’s Lowest

Selling gasoline this week at $3.18 a gallon, two Tulare County gas stations are offering fuel at the lowest price in the state says Gas Buddy. The two stations are the Valero on Blackstone at E Prosperity in Tulare and Eagle Feather Trading Post on Hwy 190 near Porterville.Nearly a dozen other stations in the county follow at $3.19 as the region is the Golden State’s low cost leader  – competitive for the first time in recent memory.

Gas Buddy says the average price for regular in the state is $3.56,down from an average  of $3.66 a month ago.

California Payrolls Up – Jobless Rate Falls To 8.7% / SLO County At 6.1% / Tulare County 12.7%

Screen shot 2013-01-19 at 11.41.42 AMCalifornia’s Unemployment rate decreases to 8.7 percent in September, unchanged in October

SACRAMENTO – California’s nonfarm payroll jobs increased by 39,800 in October for a total gain of 868,300 jobs since the recovery began in February 2010, according to data released today by the California Employment Development Department (EDD). California’s unemployment rate was 8.7 percent in September and October, down from 8.9 percent in August.
The U.S. unemployment rate increased to 7.3 percent in October, up from 7.2 percent in September.
In October 2012, the state’s unemployment rate was 10.1 percent, and in September 2012, the rate was 10.2 percent. The unemployment rate is derived from a federal survey of 5,500 California households.
____________________________________________________________________________
In Central California San Luis Obispo’s unemployment was 6.1% compared to 7.4% a year earlier and 6.10% in September 2013. There were some 700 more jobs in the county recorded than a year ago.
In Tulare County the jobless rate was 12.27% compared to 14.5% a year ago but up from 12.2% in September 2013 in part because of 2000 fewer farm jobs at the end of the harvest.
_____________________________________________________________________________
Nonfarm jobs in California totaled 14,713,600 in October, an increase of 39,800 jobs over the month, according to a survey of businesses that is larger and less variable statistically. The survey of 42,000 California businesses measures jobs in the economy. In September, nonfarm jobs totaled 14,673,800, a decrease of 2,900 jobs over the month. The year-over-year change, October 2012 to October 2013, shows an increase of 207,300 jobs (up 1.4 percent). The year-over-year change, Sept. 2012 to Sept. 2013, shows an increase of 220,900 jobs (up 1.5 percent).
EMPLOYMENT AND UNEMPLOYMENT IN CALIFORNIA
The federal survey of households, done with a smaller sample than the survey of employers, shows a decrease in the number of employed people. It estimates the number of Californians holding jobs in October was 16,994,000, a decrease of 13,000 from September 2013, but up 338,000 from the employment total in October of last year
The number of people unemployed in California was 1,612,000 – down by 18,000 over the month, and down by 250,000 compared with October of last year.
PAYROLL EMPLOYMENT DETAIL (SEASONALLY ADJUSTED)
EDD’s report on payroll employment (wage and salary jobs) in the nonfarm industries of California totaled 14,713,600 in October, a net gain of 39,800 jobs since the September survey. This followed a loss of 2,900 jobs in September. (See industry data for September in attached payroll employment chart on page 3.)
Nine categories (mining and logging; construction; trade, transportation and utilities; information; professional and business services; educational and health services; leisure and hospitality; other services; and government) added jobs over the month, gaining 49,100 jobs. Government posted the largest increase over the month, adding 12,200 jobs.
Two categories (manufacturing and financial activities) reported job declines over the month, down 9,300 jobs. Manufacturing posted the largest decrease over the month, down 5,600 jobs.
In a year-over-year comparison (October 2012 to October 2013), nonfarm payroll employment in California increased by 207,300 jobs (up 1.4 percent).
Nine categories (mining and logging; construction; trade, transportation and utilities; information; financial activities; professional and business services; educational and health services; leisure and hospitality; and other services) posted job gains over the year, adding 216,400 jobs. Leisure and hospitality posted the largest gains on a numerical and percentage basis, adding 75,100 jobs (up 4.6 percent).
Two categories (manufacturing and government) posted job declines over the year, down 9,100 jobs. Manufacturing posted the largest decline on a numerical basis, down by 5,800 jobs (a 0.5 percent decrease).
UNEMPLOYMENT INSURANCE CLAIMS (NOT SEASONALLY ADJUSTED)
In related data, the EDD reported that there were 405,761 people receiving regular Unemployment Insurance benefits during the October survey week. This compares with 362,532 last month and 453,448 last year. At the same time, new claims for unemployment insurance were 72,737 in October 2013, compared with 37,333 in September and 55,543 in October of last year.


AMTRAK CALIFORNIA SET RAIL RIDERSHIP RECORD

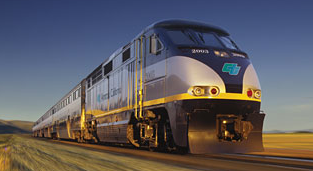
Screen Shot 2013-11-22 at 5.42.43 AMSACRAMENTO – In a state noted for its freeways, Californians are riding trains in unprecedented numbers. In 2012-13, Amtrak California carried a record 3.9 million passengers on its thriving Pacific Surfliner and San Joaquin rail lines. Over the past ten years, ridership on the Pacific Surfliner, the second-busiest rail corridor in the nation, and the San Joaquin, the fifth-busiest, increased by nearly one million passengers, and ticket revenues skyrocketed from $44 million to $102 million.

“In California, a rail renaissance is underway. Train travel is increasingly seen as a smart option,” said Caltrans Director Malcolm Dougherty.

Caltrans provides funding to run all three intercity passenger rail lines in California: the Pacific Surfliner, the San Joaquin, and the Capitol Corridor, which had a combined ridership of 5.6 million passengers in 2012-13. The recently approved 2013 California State Rail Plan includes plans to add more trips to each of the routes.

Since Caltrans began funding the Pacific Surfliner corridor between San Diego and San Luis Obispo in 1976, nearly $1 billion in capital improvements have been made, and the number of daily trains has risen nearly fourfold from three daily round trips to eleven.  In the past year ridership went from 2,640,342 in 2011-12 to 2,705,823 in 2012-13.

Caltrans has invested $460 million since 1979 to improve the San Joaquin corridor between Bakersfield-Sacramento-and the San Francisco-Oakland Bay Area. Passenger service has increased from one daily round trip to six (four between Oakland and Bakersfield and two between Sacramento and Bakersfield)

Ridership on the San Joaquin line grew from 1,144,616 passengers in 2011-12  to  1,219,818 in 2012-13.

In 2011, the Federal Railroad Administration awarded two grants to Caltrans for $168 million for the purchase of 15 rail cars for the Pacific Surfliner, three locomotives for the San Joaquin corridor, and 12 rail cars and three locomotives for the Capitol Corridor.

In Southern California, a $163 million, 15-mile main line track expansion between Commerce and Fullerton, known as the Triple Track Project, is building an additional third track next to two existing lines. The Pacific Surfliner, Metrolink, and freight trains currently share two tracks, which can create congestion.

Additionally, in 2012, three new tracks opened at Los Angeles Union Station along with a platform to serve Amtrak and Metrolink passengers.

Study Finds Climate Link to Atmospheric-River Storms

On average, about 30-50% of annual precipitation in the west coast states occurs in just a few AR events, thus contributing to water supply-NOAA

Screen Shot 2013-11-21 at 6.20.46 AM

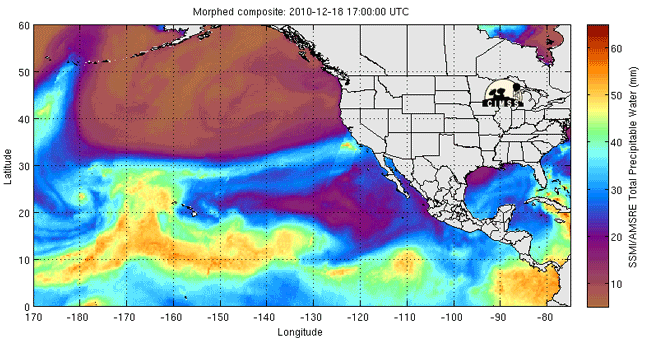
Pineapple Express:Animation of the atmospheric-river event. This animation shows an atmospheric river event over Dec. 18-20, 2010. High-altitude winds pull large amounts of water vapor (yellow and orange) from the tropical ocean near Hawaii and carry it straight to California

November 08, 2013
PASADENA, Calif. – A new NASA-led study of atmospheric-river storms from the Pacific Ocean may help scientists better predict major winter snowfalls that hit West Coast mountains and lead to heavy spring runoff and sometimes flooding. 

Atmospheric rivers — short-lived wind tunnels that carry water vapor from the tropical oceans to mid-latitude land areas — are prolific producers of rain and snow on California’s Sierra Nevada mountains. The finding, published in the journal Water Resources Research, has major implications for water management in the West, where Sierra runoff is used for drinking water, agriculture and hydropower. 

The research team studied how two of the most common atmospheric circulation patterns in the Northern Hemisphere interact with atmospheric rivers. They found when those patterns line up in a certain way, they create a virtual freeway that leads the moisture-laden winds straight to the Sierras. 

Bin Guan of the Joint Institute for Regional Earth System Science and Engineering, a collaboration between NASA’s Jet Propulsion Laboratory in Pasadena, Calif., and UCLA, led a team of scientists from NASA, UCLA and the National Oceanic and Atmospheric Administration (NOAA) on this research.

“a virtual freeway that leads the moisture-laden winds straight to the Sierras.”

An atmospheric river is a narrow stream of wind, about a mile (1.6 kilometers) high and sometimes of hurricane strength. Crossing the warm tropical Pacific in a few days, it becomes laden with water vapor. A moderate-sized atmospheric river carries as much water as the Mississippi River dumps into the Gulf of Mexico in an average week. When the river comes ashore and stalls over higher terrain, the water falls as snow or rain. 

”Atmospheric rivers are the bridge between climate and West Coast snow,” said Guan. “If scientists can predict these atmospheric patterns with reasonable lead times, we’ll have a better understanding of water availability and flooding in the region.” The benefit of improving flood prediction alone would be significant. A single California atmospheric-river storm in 1999 caused 15 deaths and $570 million in damage. 

Guan’s team used data from the JPL-developed Atmospheric Infrared Sounder (AIRS) instrument on NASA’s Aqua satellite, along with NOAA satellite data and snowpack data from the California Department of Water Resources. They looked at the extremely snowy winter of 2010-2011, when 20 atmospheric rivers made landfall. 

The team compared the dates of these events with the phases of the Arctic Oscillation (AO) and the Pacific/North American teleconnection (PNA). These large-scale weather patterns wax and wane, stretching thousands of miles across the atmosphere and shaping the climate of the mid-latitudes, somewhat as the better-known El Niño and La Niña patterns do in the tropical Pacific. 

Each pattern affects a different part of the Northern Hemisphere by seesawing between phases of lower-than-average and higher-than-average air pressure over various parts of the globe. For example, the negative phase of the AO is associated with higher pressure in the Arctic and lower pressure in the surrounding lower latitudes. In the positive phase, those highs and lows are reversed. 

The phases of each pattern change irregularly and at varying intervals. The researchers charted these phases throughout the winter of 2010-2011. During 15 of the winter’s 20 atmospheric river occurrences, both patterns were in the negative phase. The team then looked at the period 1998-2011 and found a similar correspondence: more atmospheric rivers occurred when both patterns were negative. 

According to Guan, in the double-negative periods, the high- and low-pressure systems associated with that phase in each pattern mesh to create a lingering atmospheric low-pressure system just northwest of California. That low directs the atmospheric river fire hose straight toward the Sierra Nevadas. 

Guan points out that the double-negative phase correlation is rare. 

”I looked at 50 years of atmospheric data. Only five months had those phases of the PNA and AO occurring together for more than 15 days of the month,” he said. 

AIRS was built and is managed by JPL for NASA’s Science Mission Directorate in Washington. Aqua is managed by NASA’s Goddard Space Flight Center, Greenbelt, Md. JPL is a division of the California Institute of Technology in Pasadena. 

For more information on AIRS, visit: http://airs.jpl.nasa.gov .

Todays Biz News Round Up… JSF Decision Postponed / More

Screen Shot 2013-11-18 at 2.10.29 PMJSF Base Decision Put Off Till Spring
We will have to wait a few more months to see the final EIS document on basing the navy’s new Joint Strike Fighter planes on the West Coast .The US Navy’s decision on home basing the squadron was expected to be finalized by the end of 2013. But Ted Brown, spokesperson for the US Navy, says the government shutdown postponed the decision on which location to pick – Lemoore or El Centro.

The draft EIS released last winter had given the nod to Lemoore over El Centro for the 100 plane base. Now we are awaiting the final EIS report.The Secretary of the Navy will be making the final decision 30 days after the final EIS release.

Earlier in November the El Centro City Council agreed to contribute $10,000 to the Imperial Valley United for Joint Strike Fighter Home basing Coalition to increase their lobbying efforts for the basing of the F35C Squadron in El Centro.

Corn falls to $4.12 a bushel in the futures market for December delivery.

Lowest price for gasoline in the state is near Tracy where a Safeway station is selling regular for $3.17. Nine stations in the state are selling gas for under $3.20 a gallon today says Gas Buddy.

The price of WTI oil has dropped to $92.99 for December delivery compared to $108 this time in September.

October New Home Sales
Tulare: New home sales volume is up 20.5% in Oct 2013(53 homes) compared 44 homes sold in Oct 2012.

SLO County: New Home Sales in SLO County jumped to 38 in Oct 2013 compared to just 8 in Oct 2012.

Existing Home Sales: Tulare saw 325 home sales in October compared to 372 this time in 2012, a 12.6% decrease. Median home price increased 15.7% to $155,000 from $134,000 in Oct 2012.

SLO County Existing Sales dropped 16.5% to 248 in Oct 2013 from 297 sold in Oct 2012.The median price increased 15.55% to $439,000 from $380,000 in Oct 2012.

Pucker Up: California’s tangerine crop is expected to be up 4% from last year with this year’s crop pegged at at 27.0 million cartons. The rest of the state citrus crop is estimated to be same as last year.

California’s New Vehicle Market Up Again

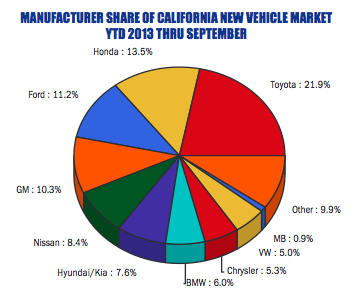
Screen Shot 2013-11-18 at 6.50.19 AMThe California new vehicle market maintained its impressive winning streak during the summer of 2013. New light vehicle registrations in the state increased 13.8 percent in the Third Quarter of this year versus a year earlier, the 12th consecutive quarterly year-over-year improvement according to the California New Car Dealers Assn.

Total registrations for all of this year are expected to exceed 1.7 million units, an increase of more than 177,000 units from 2012 and up by over 670,000 from the recessionary low point in 2009. Auto Outlook is predicting that registrations in 2014 will exceed 1.8 million units, a 6 percent increase over this year. Other key trends in the state market:

Among the top 15 selling brands, Subaru, Dodge, Mazda, BMW, and Ford had the biggest percentage increases during the first nine monthsof this year. New registrations for each of the five brands increased by more than 18 percent

Domestic brand registrations increased 18.5 percent during the first nine months of this year and market share increased 1.3 points. Korean brands had a small decline and market share fell by one point.

Hybrid vehicle registrations (excluding plug ins) exceeded 90,000 units thru September of this year, less than 4,000 shy of the total for all of Electric vehicle market share was 1.2 percent. Hybrid cars market share in the state is now 7% – up from 5% in 2011.

Prius remains the top seller in California.

Meanwhile,used vehicle registrations fell 5.2 percent. Three year old or newer vehicles were up 16 percent, as supply shortages are easing.

California Trends

New light vehicle registrations (including retail and fleet transactions) in California increased 12.9 percent during the first nine months of this year versus a year earlier, higher than the 8.7 percent improvement in the U.S. market . Passenger car share of the overall light vehicle market in California was 62.5 percent, exceeding National levels by nearly 12 share points. Domestic brand market share (the Detroit Three) in California was 27.8 percent, up from last year, but well below the 45.2 percent share nationally. Japanese brand share in the state was 12 points higher than nationally.

Weather Watch: California To Get Some Rain

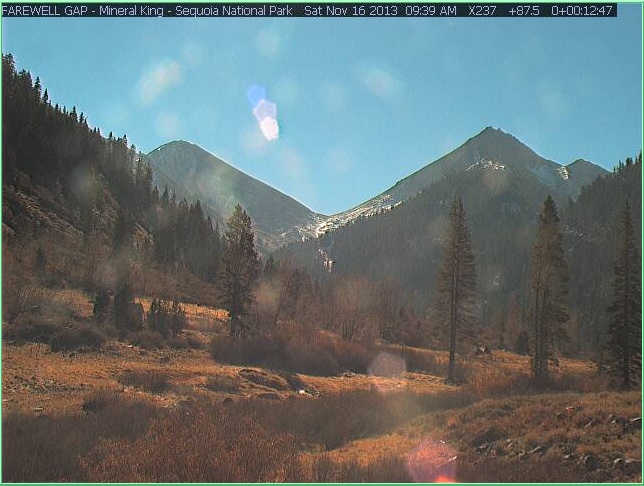
Mineral King Valley - all dry. photo from webcam this weekend
Mineral King Valley – all dry.
photo from webcam this weekend

Northern and north Central California are likely to get their best chance for rain so far this dry seasons between November 19 -22 say forecasters.

Tahoe’s high Sierra should get some snow over the 3 day period as rain come to the Bay Area and Monterey as well as Fresno mountains getting one quarter to one half inch says forecaster Alan Fox.

The storms won’t be cold and that warm weather following the the 22nd could be ”snow eaters”. Fox says a second system could come into the state November  29 thru early December  but like  this weeks storms will not be heavy rainmakers like we need them to be.

Fox says looking long range ”at this point it appears California is on track is for a below average rainfall this winter.”  Ouch!

Regarding this week the NWS Hanford lists Wednesday as the best chance for the Fresno area to get some rain.The Redding area, home to Shasta Lake – gets rain Tuesday and the Bay Area Tuesday night.

For the San Luis Obispo area here is what PG&E weatherman John Lindsey says about this week.

“A cold front is expected to pass through Northern California later on Tuesday with moderate rain for areas north of Sonoma County and light rain as far south as Monterey Bay.

This cold front will significantly weaken as it moves down the California coastline and is expected to pass over San Luis Obispo County on Wednesday with increasing clouds and a chance
for sprinkles or light rain showers. If we get any measurable rainfall, it will only be a few hundreds of an inch. Snow levels in the Sierra will range between 6,000 and 7,000 feet.
Dry and warmer weather will develop on Thursday and will continue through next weekend.”

Worst Start Ever?

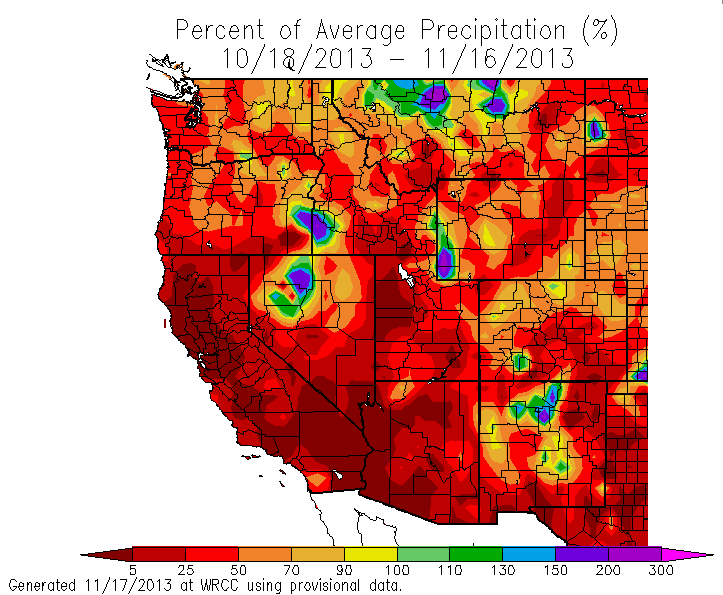
How bad is it? The Chronicle  reported that “No rain at all fell in San Francisco in October and only 3.95 inches has fallen since Jan. 1, the smallest amount of precipitation to date since record keeping began 164 years ago, according to the National Weather Service.”

The California Data Center says the Southern San Joaquin Valley Precipitation Index so far this water year stands at 0.9in – below the average for a dry-year scenario.The water year starts Oct 1.

how dry we are
how dry we are

Retail: Sears Has 40% Fewer Stores Than 7 Years Ago

Screen Shot 2013-11-16 at 7.51.57 AMA financial report says ” Sears Holdings Corp. announced a number of actions this past week prior to releasing its earnings report for the third quarter. Sears warned that its third-quarter EBITDA loss will widen to $250 million to $300 million, compared with last year’s comparable-period EBITDA loss of $156 million.

The beleaguered retail giant said it would continue to evaluate its U.S. stores by reviewing each location, including leased locations that are set to expire, and decide whether or not to renew leases for them.

Chicago-based Sears also announced it was evaluating spinning off both its Lands’ End and Sears Auto Center businesses.

However, while these asset sales will provide liquidity, they do not help Sears overcome its bigger problem – namely, how to stem losses and stabilize revenues.

Sears, which had 3,418 stores, including its Kmart brand, as of March 2007, now has fewer than 2,073 – a reduction of nearly 40%.”

California Export Surge Continues

Ag Exports Jump 17.2%

November 14, 2013 – California’s exporters turned in another strong showing in September, according to a Beacon Economics’ analysis of foreign trade data released this morning by the U.S. Commerce Department

For the month of September, the state’s merchandise export trade totaled $13.78 billion, a nominal 7.1% increase over the $12.87 billion in exports recorded in September 2012. By comparison, exporters in Texas managed only a 3.9% gain over the same period.

 The uptick in California was led by a solid $380 million increase in manufactured exports, which rose by 4.6% to $8.80 billion from $8.42 billion last September.

 Meanwhile, the state’s exports of non-manufactured goods (chiefly agricultural produce and raw materials) grew by $260 million, up 17.2% to $1.77 billion from $1.51 billion last year. Re-exports were up by $270 million, from $2.94 billion to $3.21 billion, an increase of 9.2%. Year-to-date, California’s $122.96 billion merchandise export trade is running slightly ahead of the $121.14 billion recorded in the same period last year.

 “Given the generally sclerotic state of much of the global economy these days, September’s numbers could almost be described as gravity-defying,” said Jock O’Connell, Beacon Economics’ International Trade Adviser.

 The strong August showing boosted California’s export tally during the year’s first eight months to $109.18 billion, marginally ahead of the $108.27 billion recorded in the same period last year.

Gasoline Prices Expected To Fall Further

U.S. Energy Information Administration Administrator Adam Sieminski issued the following comments Wednesday on EIA’s November 2013 Short-Term Energy Outlook:

Screen shot 2012-06-09 at 7.35.08 AMGasoline: “U.S. gasoline prices fell during nine of the last 10 weeks and are expected to keep dropping through the end of the year. Weekly U.S. average regular gasoline retail prices fell from their summer high of $3.68 per gallon in late July to their lowest level so far in 2013 at $3.19 on November 11.”“EIA expects that falling crude oil prices and a well supplied gasoline market will help drive U.S. retail gasoline prices down further for the remainder of the year, falling to a monthly average of $3.17 per gallon in December.”

United States produced more crude oil in October than it imported for the first time since early 1995.

Crude Oil: “As EIA predicted back in March, it appears the United States produced more crude oil in October than it imported for the first time since early 1995. Monthly estimated domestic crude oil output averaged 7.7 million barrels per day in October, which was the highest production for any October in 25 years, while oil imports were 7.6 million barrels per day.”
“The discount of WTI crude oil spot prices to Brent crude oil has widened from just over $3 a barrel in July to $9 in October, as refinery demand has returned to normal, lower seasonal demand levels, and U.S. crude inventories have begun to grow at the Cushing, Oklahoma, storage hub.  EIA forecasts that growing non-OPEC crude production will continue to outpace refinery demand, leading to an average WTI discount to Brent of $10 per barrel in the fourth quarter of 2013 and $8 per barrel in 2014.”
“After averaging nearly $103 per barrel for three consecutive months from April to June, Brent crude oil prices increased to around $110 per barrel from July through October as a result of strong U.S. refinery demand and supply disruptions in the Middle East.  EIA expects that growing non-OPEC crude oil production will help drive Brent crude oil prices lower.”

Natural Gas: “EIA boosted its forecast for U.S. marketed natural gas production by 0.4% this year and nearly 1% for next year, as domestic natural gas output reached record levels during the past several months despite lower gas prices.  Gas from the Marcellus Shale has been the main driver of this production growth.”
“This month’s forecast lowers U.S. natural gas imports by pipeline, mostly from Canada, as domestic gas production increases.”

Coal: “The increase in coal consumption this year is mainly due to the electric power sector, which burned more coal because of higher natural gas prices. Most of the growth in coal consumption this year is expected to be met by drawing down 35 million short tons in domestic coal inventories .U.S. coal production is forecast to increase by 2.7% next year as inventories stabilize and coal consumption increases.”

During the first eight months of 2013, renewable energy, including hydropower, supplied 19.1% of total electricity generation in California compared with 12.2% during the same period five years ago.

Electricity:“Electricity generation from renewable energy sources other than hydropower currently accounts for about 6% of total U.S. generation, but renewables play a bigger role in some states.” “California has experienced strong growth in the use of renewable energy by the power sector. During the first eight months of 2013, renewable energy, including hydropower, supplied 19.1% of total electricity generation in California compared with 12.2% during the same period five years ago. Development of new renewable energy generating capacity has been encouraged by a combination of an aggressive state renewable portfolio standard, continued federal tax credits, and the implementation of a state greenhouse gas emissions cap-and-trade program.”

Renewables:“Wind power generation is forecast to grow by 17% this year and by nearly 4% in 2014, accounting for more than 4% of total U.S. electricity generation next year.”
“EIA expects continued robust growth in solar power, with solar generation by the U.S. electric power sector increasing 82% this year and jumping another 84% in 2014. However, utility-scale solar power will continue to be a small share of total U.S. electric generation at less than 1%.”

U.S. Liquid Biofuels: “U.S. ethanol production has recovered from last year’s drought.  Ethanol production increased from an average of 806,000 barrels per day in October 2012 to 892,000 barrels per day this October, and is forecast to grow to 900,000 barrels per day during 2014.“