California Exports Slip Amid Global Conditions

August 7,2015-

California’s export trade in June declined in value from the same month last year, according to a Beacon Economics analysis of foreign trade data released this morning by the U.S. Commerce Department.

Screen shot 2012-06-15 at 12.12.22 PMThe state’s exports of goods to foreign markets in June totaled $15.11 billion, down 4.2% from the $15.77 billion recorded in June 2014. By way of comparison, overall U.S. merchandise exports fell by 5.3% over the same period, while exports from Texas shrank by 10.2%.

California’s exports of manufactured goods in June dropped by 5.5% to $9.42 billion from $9.96 billion last year. Exports of non-manufactured goods (chiefly agricultural produce and raw materials) tumbled by 12.5% to $1.71 billion from $1.95 billion the previous June. Re-exports rose by 3.1% to $3.99 billion from $3.86 billion.

“Given the condition of the global economy right now, California’s June export numbers certainly could have been a lot worse,” said Jock O’Connell, Beacon Economics’ International Trade Adviser. “The economy of China, our third largest overseas customer, has been decelerating at a much steeper pace than the official figures out of Beijing would indicate. Europe continues struggle to find a path to sustained growth, and a collapse in commodity prices have sent major developing economies like Brazil and Indonesia teetering.”

California’s export trade so far this year is lagging behind last year’s pace by 2.7%.

A Closer Look At The Numbers

As always, Beacon Economics cautions against reading too much into month-to-month fluctuations in state export statistics, especially when focusing on specific commodities or destinations. Significant variations may occur as the result of unusual developments or exceptional one-off trades and may not be indicative of underlying trends. For that reason, Beacon Economics compares the latest three months for which data are available (i.e., April – June) with the corresponding period one year earlier.

California’s merchandise exports during the April-June period totaled $43.62 billion, a nominal decline of 0.9% from the $44.03 billion recorded during the same period twelve months earlier. The state accounted for 11.5% of total U.S. merchandise exports in the latest three months.

California’s export trade is highly diversified. Eleven major categories of goods each accounted for at least $1 billion in exports in the latest three-month period. Among the top ten categories, performance was variable in the latest quarter with only four categories showing growth.

On the plus side, topping the export list was Computer & Electronic Products, up 6.6% to $10.89 billion from $10.22 billion. Transportation Equipment exports rose 7.5% to $4.76 billion from $4.43 billion. Non-electrical Machinery exports jumped 12.2% to $4.14 billion from $3.69 billion, and exports of Agricultural Products rose 6.2% to $3.42 billion from $3.22 billion.

On the downside, exports of Miscellaneous Manufactured goods fell 5.1% to $4.15 billion from $4.37 billion. Chemical exports were off 3.3% to $3.37 billion from $3.48 billion. Exports of Food and Kindred Products plummeted by 14.9% to $2.47 billion from $2.90 billion. Electrical Equipment exports slipped by 0.8% to $1.77 billion from $1.78 billion. Exports of Petroleum and Coal Products dropped by 25.6% to $1.37 billion from $1.84 billion. Fabricated Metal exports fell 14.0% to $1.06 billion from $1.23 billion. Finally, exports of Waste and Scrap dipped 11.6% to $1.10 billion from $1.15 billion.

Mexico continued to rank as California’s single largest export destination during the latest three-month period, with the value of exports jumping 13.3% to $7.11 billion from $6.27 billion. Exports to Canada slipped by 1.7% to $4.33 billion from $4.41 billion, while shipments to China dropped by 10.5% to $3.76 billion from $4.21. Exports to Japan also declined by 2.4% to $3.10 billion from $3.08 billion.  South Korea, up 11.0% to $2.37 billion from $2.14 billion, rounded out California’s ‘Top Five’ national export destinations in the April-June quarter.

Regionally, California’s exports to the Asia Pacific region (including Australia and New Zealand) dropped 3.5% to $16.37 billion from $16.96 billion, a dip propelled largely by the fall-off in exports to China. California’s exports to the European Union slipped by 1.3% to $7.48 billion from $7.58 billion.

California’s exports to Latin America and the Caribbean (excluding Mexico) were down by 19.5% to $2.35 billion from $2.92 billion. California’s exports to South Asia (chiefly India and Pakistan) were up by 28.3% from $1.08 billion to $1.39 billion. The state’s exports to Sub-Saharan Africa in the latest three months amounted to just $210 million, up 8.3% from $194 million during the same period twelve months earlier.

By mode of transportation, 46.3% of California’s $43.62 billion merchandise export trade in the latest three months was shipped by air, with Los Angeles International and San Francisco International Airports accounting for the vast majority of the state’s airborne trade. Seaports handled 30.4% of the state’s export trade, while 30.7% traveled overland by truck or rail to Canada and Mexico.

The Outlook

Beacon Economics’ outlook for California’s merchandise export trade remains guarded. We are not encouraged by recent actions by Chinese authorities and expect exports to China (the state’s third largest export market) to continue to decline through the balance of this year.

Exports to Canada (California’s second largest export destination) have been ebbing lately, largely as a result of increasingly unfavorable exchange rates. While we expect modest growth in the state’s exports to Europe later this year, the biggest gains are likely to be seen in California’s exports to Mexico. As we have noted previously, a very sizable portion of California’s export trade with Mexico involves factories south of the border that export the vast majority of their output to the United States. In that way, California’s export trade with Mexico tends to rise or fall in tandem with economic activity in the U.S. rather than in Mexico.

U.S. Marine Corps Declares the F-35B Operational

FROM THE HEADQUARTERS U.S. MARINE CORPS // July 31, 2015


The U.S. Marine Corps’ F-35B Lightning II aircraft reached initial operational capability today with a squadron of 10 F-35Bs ready for world-wide deployment.

Marine Fighter Attack Squadron 121 (VMFA-121), based in Yuma, Arizona, is the first squadron in military history to become operational with an F-35 variant, following a five-day Operational Readiness Inspection (ORI), which concluded July 17.

“I am pleased to announce that VMFA-121 has achieved initial operational capability in the F-35B, as defined by requirements outlined in the June 2014 Joint Report to Congressional Defense Committees,” said Gen. Joseph Dunford, Commandant of the Marine Corps. “VMFA-121 has ten aircraft in the Block 2B configuration with the requisite performance envelope and weapons clearances, to include the training, sustainment capabilities, and infrastructure to deploy to an austere site or a ship. It is capable of conducting close air support, offensive and defensive counter air, air interdiction, assault support escort and armed reconnaissance as part of a Marine Air Ground Task Force, or in support of the Joint Force.”

Dunford stated that he has his full confidence in the F-35B’s ability to support Marines in combat, predicated on years of concurrent developmental testing and operational flying.

“Prior to declaring IOC, we have conducted flight operations for seven weeks at sea aboard an L-Class carrier, participated in multiple large force exercises, and executed a recent operational evaluation which included multiple live ordnance sorties,” said Dunford.  “The F-35B’s ability to conduct operations from expeditionary airstrips or sea-based carriers provides our Nation with its first 5th generation strike fighter, which will transform the way we fight and win.”

As the future of Marine Corps tactical aviation, the F-35 will eventually replace three legacy platforms: the AV-8B Harrier, the F/A-18 Hornet, and the EA-6B Prowler.

“The success of VMFA-121 is a reflection of the hard work and effort by the Marines in the squadron, those involved in the program over many years, and the support we have received from across the Department of the Navy, the Joint Program Office, our industry partners, and the Under Secretary of Defense.  Achieving IOC has truly been a team effort,” concluded Dunford.

The U.S. Marine Corps has trained and qualified more than 50 Marine F-35B pilots and certified about 500 maintenance personnel to assume autonomous, organic-level maintenance support for the F-35B.

VMFA-121’s transition will be followed by Marine Attack Squadron 211 (VMA-211), an AV-8B squadron, which is scheduled to transition to the F-35B in fiscal year 2016.  In 2018, Marine Fighter Attack Squadron 122 (VMFA-122), an F-18 Hornet squadron, will conduct its transition.

Tags

Housing Market Best Since 2006

July 24,2015-

from RealtyTrac

RealtyTrac: Single-family home sales reach highest level since 2006
FHA buyer share climbs to two-year high; Cash buyers dwindle

Screen shot 2012-07-05 at 7.20.30 AMAdding another layer of confirmation onto the prevailing thought that 2015 is a healthy year for housing, single-family and condo sales reached the highest level since 2006, according to a new report from RealtyTrac.
RealtyTrac’s June and Midyear 2015 U.S. Home Sales Report showed that there were 914,291 single-family and condo sales through April 2015, which is the most recent month with complete sales data available.
Those figures mark the highest level through the first four months of a year since 2006.
The number of single family homes and condos sold in the first four months of 2015 were at the highest level in the first four months of any year since 2006 in 43 out of 264 (16%) metropolitan statistical areas with sufficient home sales data. Markets at nine-year highs included Tampa, Denver, Columbus, Ohio, Jacksonville, Florida, and San Antonio.
There were 23 markets where sales volume in the first four months of 2015 was at 10-year highs, including Denver; Columbus, Ohio; San Antonio; Tucson, Arizona; and Palm Bay-Melbourne-Titusville, Florida.
Among major metro areas with a population of 1 million or more, 22 out of 51 markets (43%) were at eight-year highs for single family home and condo sales in the first four months of the 2015, including New York, Dallas, Houston, Seattle and Portland.
Additionally, RealtyTrac’s report showed that distressed sales, cash sales and institutional investor sales in June were all down from a year ago to multi-year lows.
The report also showed that sales to first-time homebuyers and other buyers using Federal Housing Administration loans increased compared to a year ago in June and reached a two-year high in the second quarter.
Buyers using FHA loans accounted for 23% of all single-family home and condo sales with financing — excluding all-cash sales — in the second quarter of 2015, up from 20% in the first quarter and up from 19% in the second quarter of 2014 to the highest share since the first quarter of 2013.
Nationwide, buyers using FHA loans accounted for 22% of all financed sales in the first half of 2015, up from 19% of all sales in 2014 and up from 20% of all sales in 2013.
Among markets with a population of 1 million or more, those with the highest share of buyers using FHA loans in the first six months of 2015 were Riverside-San Bernardino-Ontario in inland Southern California (35%); Las Vegas (32%); Oklahoma City (31%); Salt Lake City (30%); and Phoenix (29%).
Major markets with the lowest share of buyers using FHA loans in the first six months of 2015 were San Jose, California (7%); Hartford, Connecticut (10%); San Francisco (12%); Boston (12%); and Milwaukee (13%).

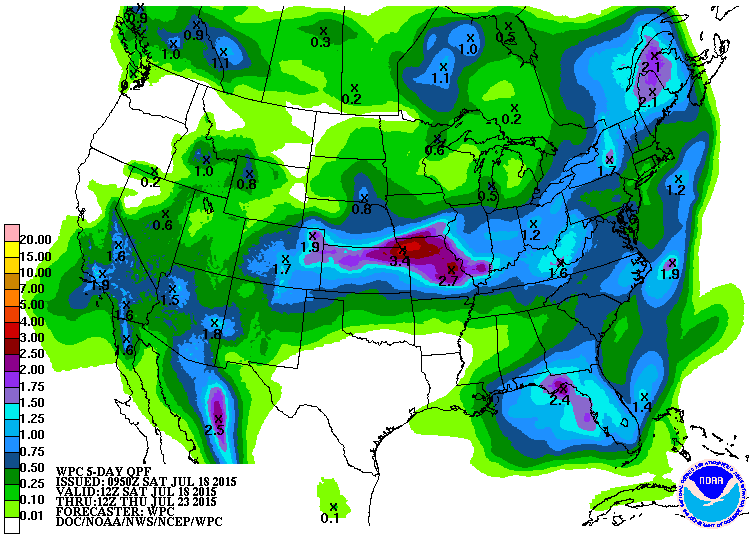
NOAA: Hurricane Dolores To Drop 1.9 to 1.6 Inches Over Next Five Days

July 18,2015-

South Coast & Sierra In The Path of Thunderstorms

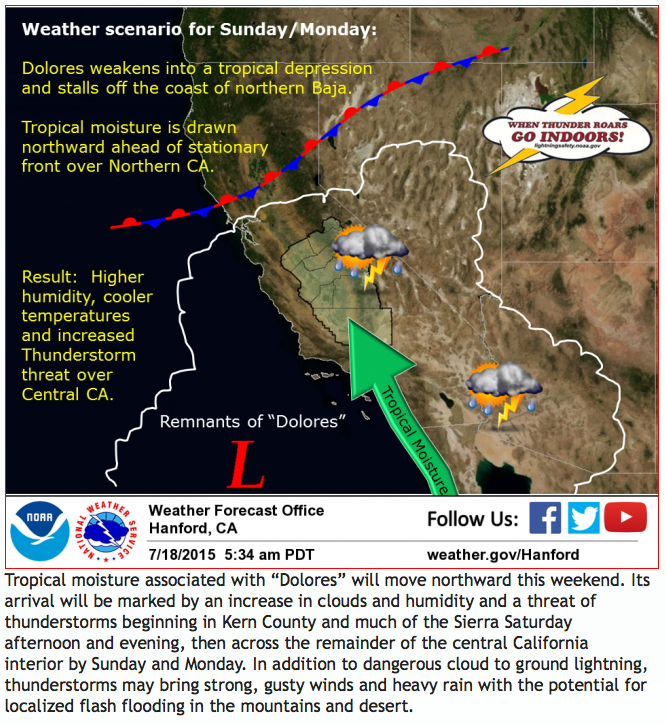
Hurricane Dolores coming up from Baja will morph inot a tropical depression but is expected to stall off the Southern California coast sending in waves of unstable precip into the state Sunday and Monday.

Pictured are several graphic representations of what is expected to happen in coming days including ( lower map – precip accumulation) near 2 inches coming into the the Santa Barbara area over the next 5 days andScreen Shot 2015-07-18 at 6.50.13 AMScreen Shot 2015-07-18 at 8.36.18 AM 1.6 inches in the Sierra.

SLO forecaster John Lindsey says today “This morning’s model runs are indicating between one quarterand three quarters of an inch of rain could accumulate throughout San Luis Obispo and Santa Barbara counties. Even higher amounts of precipitation is advertise in the coastal  mountains.

If these models verify, it could be the most rain we’ve ever  received during the month of July. The previous record for San Luis Obispo was 0.46 inches set in 1950.”

Gold Loses Glitter As Investment

July 17,2015-

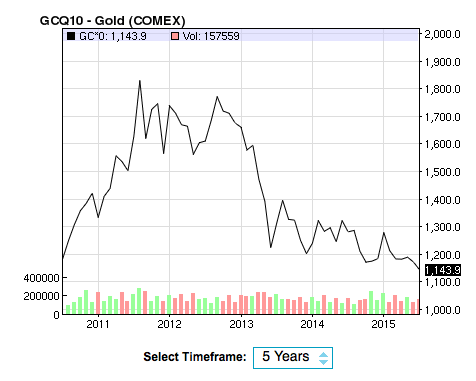
There were the days that gold seemed to zoom higher and higher.But in late 2013 a free fall began taking the value of gold from over $1800 an ounce to around $1130 today  -when it hit a 5-year low.

The reason why – loss of fear in the economy and the future. Visions of hyper inflation and collapsing economies just have not happened despite that famous “wall of worry.”

Gold is sold to some buyers based on fear of world turmoil, government debt or massive deficit spending. Or how about war with Iran.

Consider instead that job creation has been good, inflation low and the Federal Reserve is expected to raise interest rates that will strengthening the dollar. This will continue to reduce gold’s glitter.

As for war with Iran, that too looks less likely

As this chart shows – buying gold at $1800 in 2012 means you lost  some 40% of your money today. You were much better off putting that cash under your mattress.

Screen Shot 2015-07-16 at 2.40.25 PM

Fresno Jobless Rate Falls To 9.5%

July17,2015-

Manufacturing led month-over growth with 1,100 jobs

Despite Drought- Farm Jobs Are Up

Screen shot 2013-01-19 at 11.41.42 AMThe unemployment rate in the Fresno County was 9.5 percent in June 2015, down from a revised 9.7 percent in May 2015, and below the year-ago estimate of 10.9 percent. This compares with an unadjusted unemployment rate of 6.2 percent for California and 5.5 percent for the nation during the same period.

Between May 2015 and June 2015, total industry employment increased by 1,200 jobs (up 0.3 percent) to total 382,900. Nonfarm employment rose by 600 jobs (up 0.2 percent), and farm employment gained 600 jobs (up 1.0 percent).

The largest month-over increase was reported in manufacturing with the addition of 1,100 jobs. Nondurable goods climbed by 1,000 jobs and durable goods gained
100 jobs.

Farm employment grew by 600 jobs. The melon harvest began and planting was ongoing. Garlic and onions were harvested and processed.

Leisure and hospitality registered a gain of 400 jobs with all the growth coming from accommodation and food services.

Two industry sectors reported employment gains of 100 jobs each: construction and other services.
Between June 2014 and June 2015, total industry employment increased by 12,700 jobs (up 3.4 percent). Nonfarm employment rose by 10,100 jobs (up 3.2 percent), and farm employment gained 2,600 jobs (up 4.6 percent).

Trade, transportation, and utilities reported the largest year-over increase of 2,800 jobs. Retail trade added 1,300 jobs, wholesale trade grew by 800 jobs, and transportation, warehousing, and utilities increased by 700 jobs.

Professional and business services expanded by 2,300 jobs. The entire gain was in administrative and support and waste services.

Educational and health services posted an increase of 1,800 jobs. Healthcare and social assistance added 1,500 jobs, and educational services rose by 300 jobs.

Government recorded a gain of 1,600 jobs. Gains were local government (up 800 jobs), federal government (up 500 jobs), and state government (up 300 jobs).

Manufacturing posted an increase of 900 jobs, and financial activities grew by 500 jobs.

California / SLO & Tulare County Home Sales Climb

July 16,2015-

California home sales reach highest level in two years, experience first double-digit increase since May 2012

Screen shot 2012-06-22 at 7.11.11 AMLOS ANGELES (July 15) – Sales of existing, single-family homes in June reached the highest level in two years and experienced the first double-digit increase since May 2012, the CALIFORNIA ASSOCIATION OF REALTORS® (C.A.R.) said today. Home sales in the state have risen year over year for five straight months.

The June figure – 437,000 homes increased 3.3 percent from the revised 423,000 level in May and 11 percent compared with home sales in June 2014 of 393,820. The year-to-year change is significantly higher than the previous 6-month average increase of 4.3 percent observed from December 2014-May 2015.

In our reading area San Luis Obispo County home sales jumped an impressive 24.6% year over year and 19.7% from May 2015.The median price of homes sold in SLO County was $534,650 – up 7% from May at $498,000.

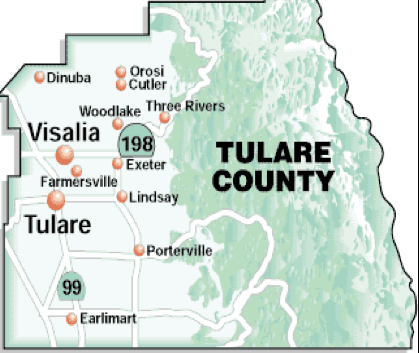
In Tulare County sales jumped 11.55% month over month and were up 8% year over year. The median price was $194,170 – up 10% from  a year ago when it was $176,000.

“Home prices continue to improve but at a more moderate rate compared with the previous year,” said C.A.R. President Chris Kutzkey. “However, in areas such as the San Francisco Bay Area where tight inventory is fueling stiff competition and generating multiple offers, home prices are still rising at or near double-digit rates, and creating a challenging environment for potential buyers in the region. “
The median price of an existing, single-family detached California home edged up in June from both the previous month and year for the fifth consecutive month. The median home price was up 0.8 percent from $485,830 in May to $489,560 in June, the highest level since November 2007. June’s median price was 7 percent higher than the revised $457,700 recorded in June 2014. The median sales price is the point at which half of homes sold for more and half sold for less; it is influenced by the types of homes selling as well as a general change in values.

New Landscapes to Use a Third Less Water Under Newly Adopted Model Ordinance

July 16,2015-

from ACWA

The California Water Commission today adopted a revised model landscape ordinance that requires yards and commercial landscapes installed in California after Dec. 1 to use up to a third less water on average.

The new model ordinance, developed by the California Department of Water Resources, limits lawns in commercial settings to uses such as recreation and public assembly, requires efficient sprinkler nozzles in landscape irrigation systems and, with some exceptions, bans turf in street medians and parkways.

Joe Byrne, chair of the CWC, said adoption of the ordinance “is an important step in ensuring that California’s future growth will respect the necessity to conserve the state’s water resources,” according to the press release from DWR.

All told, the newly adopted ordinance is expected to reduce the water use of a new home by 12,000 gallons a year, or 20%.  Water use on new commercial landscapes will be cut by approximately 35%, according to the DWR release.

The new measure, called the Model Water Efficient Landscape Ordinance, can be used by cities, counties and other land-use agencies as a guide in developing their own ordinances that fit local conditions but match or exceed the efficiency of the DWR version. State law requires all land-use agencies to adopt a water-efficient landscape ordinance that is at least as efficient as the model ordinance prepared by DWR.  DWR’s model ordinance takes effect in those cities and counties that fail to adopt their own. Land-use agencies also will be required to report on ordinance adoption and enforcement each year.

The emergency executive order issued by Gov.  Jerry Brown on April 1 directed DWR to revise an existing model landscape ordinance to step up water conservation. DWR developed the revised ordinance, then held public workshops on the revisions and conducted a 15-day public comment period. Input received during that period resulted in changes to the ordinance adopted today, officials said in a statement.


Changes from the previous model ordinance include reduction in the square footage above which landscape projects are subject to the ordinance. The threshold size was reduced from 2,500 square feet to 500 square feet for new residential, commercial, industrial and institutional projects.  The average residential lot size in California is roughly 2,500 square feet.

DWR’s revision includes a prescriptive checklist as an option for compliance for landscapes less than 2,500 square feet, such as prohibiting turf in non-residential areas and in the areas between street curbs and sidewalks that are less than 10 feet wide, subject to certain conditions. The list also requires compliance with guidelines for the use of automatic sprinklers.

To encourage the reuse of water from sinks, tubs and washing machines called “graywater,” the model ordinance allows landscapes under 2,500 square feet that are irrigated only with graywater or captured rainwater to meet a simple irrigation checklist and not be subject to the entire ordinance.

The revised model ordinance also includes improvements in:

·         More efficient irrigation systems;

·         Onsite stormwater capture; and

·         Mandatory reporting on the implementation and enforcement of the ordinance by local agencies.

The ordinance requirements will take effect Dec. 1 and apply to landscaping built or significantly modified to the point of requiring a local permit, plan check or design review.

A complete description of DWR’s original proposals, public comments and revisions is found here: https://cwc.ca.gov/Documents/2015/07_July/July2015_Agenda_Item_8_Attach_1_Proposed_Revisions_to_MWELO_Final.pdf

California Gas Prices Explode Higher

July10,2015-

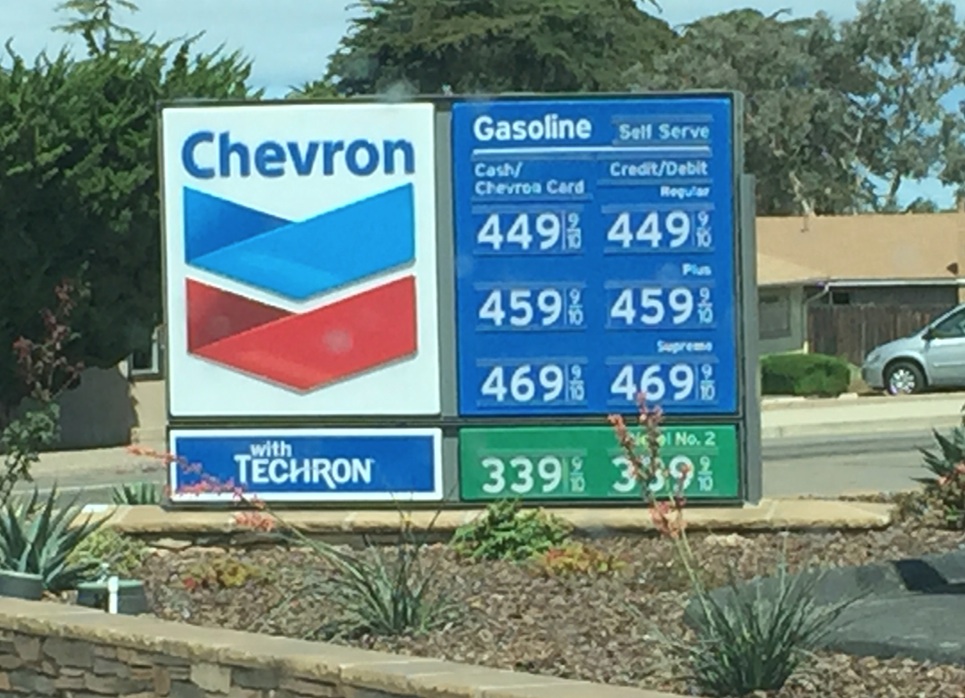
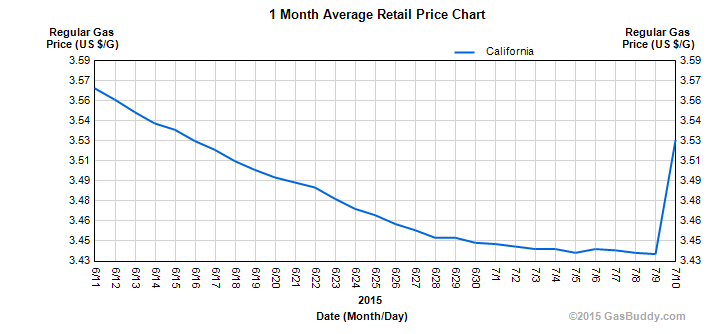
LO gas 2015-07-10 at 11.25.53 AMCalifornia gas prices exploded Thursday as supply issues again plagued the state and there were calls of price gouging.

The gas price in Los Osos  in SLO County jumped 70 cents overnight from $3.79 to $4.49.

In Visalia Costco had been selling regular for $2.99 earlier this week but that has risen to $3.07 today.

The average price in the state jumped 10 cents according to Gas Buddy today. AAA says the California average Friday is $3.49 compared to $2.57 nationwide.
It seems to have made no difference at the pump that the state gas tax fell six cents as of July 1.

In the oil arena prices have been falling in the past week. Refiners are  getting Kern oil at a bargain – about $50 a barrel.

A federal report Wednesday said California faced a “perfect storm” as refiners produced less gas and imports fell to nothing

The sudden price hike has several groups crying foul.

Consumer Watchdog announced July 9, “California drivers, who have paid an average of 74 cents more per gallon at the pump than drivers nationwide, have shelled out $4.5 billion more for their gasoline than U.S. drivers from February to June.”

Screen Shot 2015-07-10 at 11.29.36 AM

Mid-Year Report: Tulare County Home Building Jumps 40%

July 9,2015-

Screen shot 2012-05-11 at 8.49.02 AMHome building in Tulare County has jumped by some 40% so far this year compared to the first half year of 2014 according to Construction Monitor.

Through July 7, 2015 builders have permitted 562 new homes compared to 406 unit in the first half of 2014.

Lennar is the top builder in the county with 89 permits followed by Woodside Homes of Fresno based on value. Based on number  San Joaquin Valley Homes has permitted 92 homes so far this year. The local company permitted just 38 during the same period of 2013.

The value of all residential permits is $168 million compared to $127 million for the same period in 2014.

There has also been a notable increase in installation of solar panel permits on homes numbering 1200 so far this year compared to 770 during the same period in 2014.

On the commercial side the value of all commercial permits all totaled $75.7million compared $72.7 million in 2014.