Oil & Corn Head Opposite Direction

July 8,2015

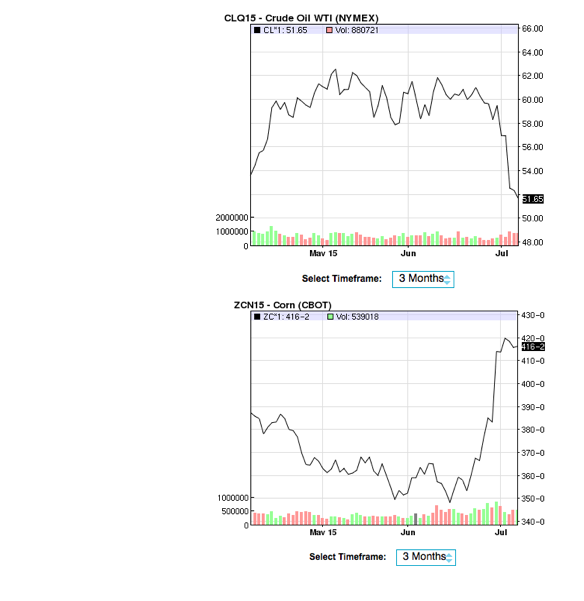
Two key commodities are heading opposite directions  this week  with oil prices going south and corn , the key feed ingredient for the dairy and livestock industry moving higher.

Screen Shot 2015-07-08 at 3.30.30 PM

WTI oil had been around the $60 mark until July 1 but has plunged to the $51-52 range as global weakness and oversupply collided.
The plunge could spell good news for motorists in California still paying gas prices that seem to be based based on $90 oil.

San Joaquin Valley crude is feeling the hurt as well with Kern’s Midway Sunset at $49 today falling from $54 a few days ago, the lowest since April.

As for corn Midwest rains are flooding fields say industry sources hurting the potential yield for this year’s crop that , based on planting , is down 2% anyway.It is the lowest planting acreage since 2010 says USDA.California corn acreage is down 17% this year.

For dairymen higher corn prices coming on the heels of weak milk prices area one- two punch they could do without. Until now the market had expected $3.50 corn this summer, now almost 20% higher.

New Report: California’s Return-to-Prison Rate Falls for the Fourth Straight Year to 54.3 percent

July 8,2015

Offenders who receive substance abuse treatment are dramatically less likely to return to prison

Screen Shot 2015-07-08 at 3.20.14 PMSACRAMENTO – The California Department of Corrections and Rehabilitation (CDCR) today released the fifth in a series of annual reports analyzing the rate at which people released from state prison return to state custody. The new report, 2014 Outcome Evaluation Report, shows that the total three-year return-to-prison rate for all offenders released during fiscal year 2009-2010 is 54.3 percent, down from 61.0 percent last year.

“Reducing recidivism and making our communities safer is a top priority for us,” said CDCR Secretary Jeff Beard. “We are committed to providing inmates and parolees with the tools they need to turn their lives around and we will continue to implement innovative and evidence-based programs to sustain this downward trend.”

The rate at which people return to prison has been trending downward since fiscal year 2005-2006 when the rate was 67.5 percent.

The 2014 Outcome Evaluation Report looked at the return-to-prison rates of offenders and found significant success among those who received substance abuse treatment. Offenders who received both in-prison substance abuse treatment and post-release aftercare had a 20.9 percent return-to-prison rate.

“This finding shows that a combination of substance abuse treatment and recovery coupled with continuing care in the community makes a big difference in helping offenders turn their lives around,” Secretary Beard said.

The 2014 Outcome Evaluation Report examines and analyzes return-to-prison rates by age, gender, ethnicity, length of time to serve, offense, county of commitment, county of parole, sentence, prior incarcerations and other characteristics.

An offender is counted as a recidivist if he or she has returned to state prison for a new crime or for a parole violation within a three-year period.

Assembly Bill 1050, enacted in September 2013, required the Board of State and Community Corrections (BSCC), in consultation with the Secretary of CDCR and others, to develop definitions of key criminal justice terms including “recidivism” in order to facilitate consistency in local data collection, evaluation and implementation of evidence-based programs.

BSCC defines recidivism as “conviction of a new felony or misdemeanor committed within three years of release from custody or committed within three years of placement on supervision for a previous criminal conviction.” BSCC’s definition also includes supplemental measures of recidivism, including arrests, returns to custody, criminal filings and supervision violations.

CDCR studies recidivism by tracking arrests, convictions and returns to prison and uses one of BSCC’s supplemental measures – returns to prison – as its primary measure. This approach is consistent with previous reports so policymakers and researchers have year-to-year comparisons. CDCR has reported the rates at which adult offenders return to prison following release from state prison since 1977.

The 2014 Outcome Evaluation Report also includes rates for arrests and convictions for offenders released between fiscal year 2002-2003 and 2011-2012. Over a 10-year period, the one-year supplemental recidivism rates show an increase in arrests and convictions while returns to prison decreased substantially. The two- and three-year supplemental recidivism rates also show a decrease in returns to state prison, but arrests and convictions are relatively steady.

The 2014 Outcome Evaluation Report shows that following the implementation of California’s Public Safety Realignment Act, there are fewer offenders who are eligible to return to state prison for parole violations. Assembly Bill 109, passed by the Legislature in 2011, was intended to close the revolving door of low-level offenders cycling in and out of state prison and it contributed to this year’s decline in the return-to-prison rate.

The 2014 Outcome Evaluation Report is published by CDCR’s Office of Research, which provides research data analysis and evaluation to implement evidence-based programs and practices, strengthen policy, inform management decisions and ensure accountability.

California Exports Slip Narrowly In Latest Numbers

July 7, 2015 – California’s merchandise export trade was narrowly lower in May than during the same month last year, according to Beacon Economics’ analysis of foreign trade data released this week by the U.S. Commerce Department.

Screen Shot 2015-07-07 at 2.26.54 PMThe state’s exports of goods to foreign markets in totaled $14.13 billion in the latest numbers, down 0.7% from the $14.23 billion recorded in May 2014. By way of comparison, total U.S. exports of goods saw a 7.2% decline in the same period, while exports from Texas shrank by a full 12.0%.

California’s exports of manufactured goods in May rose 0.3% from $9.20 billion last year to $9.23 billion. However, exports of non-manufactured goods (chiefly agricultural produce and raw materials) declined by 5.5%, from $1.91 billion to $1.81 billion. Re-exports also fell from $3.12 billion to $3.09 billion, a drop of 0.8%.

“What’s most remarkable about these new numbers is just how resilient California’s export trade has been,” said Jock O’Connell, Beacon Economics’ International Trade Adviser. “With China’s economy slowing, Europe in turmoil, key developing economies like Brazil and India faltering, and a strong dollar that has appreciably marked up the price most foreigners have to pay for U.S. goods, a modest 0.7% year-over-year decline in exports is actually something of a triumph.”

California’s export trade so far this year is lagging behind last year’s pace by 2.4% due largely to relatively sharp declines in foreign shipments in February and March.

A Closer Look At The Numbers

As always, Beacon Economics cautions against reading too much into month-to-month fluctuations in state export statistics, especially when focusing on specific commodities or destinations. Significant variations may occur as the result of unusual developments or exceptional one-off trades and may not be indicative of underlying trends. For that reason, Beacon Economics compares the latest three months for which data are available (i.e., March – May) with the corresponding period one year earlier.

California’s merchandise exports during the March-May period totaled $43.49 billion, a nominal decline of 0.5% from the $43.73 billion recorded during the same period twelve months earlier. The state accounted for 11.0% of total U.S. merchandise exports in the latest three months.

California’s export trade is highly diversified. Eleven major categories of goods each accounted for at least $1 billion in exports in the latest three-month period. Among the top ten categories, performance was variable with only five categories showing growth.

On the plus side, topping the export list was Computer & Electronic Products, up 7.6% from $10.36 billion to $11.15 billion. Non-Electrical Machinery exports gained 7.3% from $3.85 billion to $4.13 billion. Exports of Agricultural Products continued to recover from recent declines with a robust 14.1% jump from $3.27 billion to $3.73 billion. Electrical Equipment exports rose 4.0% from $1.76 billion to $1.83 billion. Chemical exports nudged higher by 0.6% from $3.47 billion to $3.49 billion.

On the downside, Transportation Equipment exports fell 7.2% from $4.60 billion to $4.27 billion. Exports of Miscellaneous Manufactured Commodities (a catchall category of merchandise ranging from medical equipment to sporting goods) were down 3.1% from $3.51 billion to $3.40 billion. Food and Kindred Products exports continued to stagger, down 11.3% from $2.91 billion to $2.58 billion.

Petroleum and Coal Products exports plummeted 26.7% from $2.03 billion to $1.49 billion. Exports of Fabricated Metal Products fell by 14.1% from $1.24 billion to $1.06 billion. Waste & Scrap exports were off 12.0% from $1.26 billion to $1.11 billion.

Mexico continued to rank as California’s single largest export destination during the latest three-month period, with the value of exports rising 15.0% from $6.16 billion to $7.09 billion. Exports to Canada fell by 1.3% from $4.45 billion to $4.39 billion, while shipments to China slipped by 6.8% from $4.16 billion to $3.88 billion. Exports to Japan also declined by 1.7% from $3.17 billion to $3.12 billion. South Korea, up 8.8% from $2.30 billion to $2.51 billion, rounded out California’s ‘Top Five’ national export destinations in the March-May period.

Regionally, California’s exports to the Asia Pacific region (including Australia and New Zealand) dropped 1.7%, falling from $16.63 billion to $16.35 billion, a dip propelled largely by the fall-off in exports directly to China. California’s exports to the European Union slipped by 0.6% from $7.77 billion to $7.72 billion. California’s exports to Latin America and the Caribbean (excluding Mexico) were down by 16.6%, dropping from $2.89 billion to $2.41 billion. California’s exports to South Asia (chiefly India and Pakistan) were up by 28.3% from $1.08 billion to $1.39 billion. The state’s exports to Sub-Saharan Africa in the latest three months amounted to just $207.4 million, down 5.3% from $219.4 million during the same period twelve months earlier.

By mode of transportation, 45.5% of California’s $43.73 billion merchandise export trade in the latest three months was shipped by air, with Los Angeles International and San Francisco International Airports accounting for the vast majority of the state’s airborne trade. Seaports handled 31.7% of the state’s export trade, while 22.3% traveled overland by truck or rail to Canada and Mexico.

While considerable attention has been focused in recent months on the economic impact of congestion at the state’s major seaports and the fall-out from a contentious longshore labor contract negotiation, it is worth noting that containerized shipments comprise only about one-fifth of the value of California’s merchandise export trade. On a dollar basis, the state’s airports play a considerably more critical role than its seaports in facilitating its merchandise export trade.

The Outlook

While today’s report looks back on recent months, the current concern in the media is what lies ahead for Europe given the likely possibility of another default and exit from the European Union by Greece. Beacon Economics believes the hype far outweighs the reality of the threat. A few years ago Greece did play a significant role in the EU slowdown—but mainly as the canary in the coal mine for wide spread public debt issues across southern Europe. Today, while Greece continues to flounder, other parts of Europe have cleaned up their act. Spain, for example, is now one of the faster growing parts of the region. As a result, the same contagion effects are not being seen this time around.

As for Greece itself? “It simply isn’t significant on its own,” says Christopher Thornberg, Founding Partner of Beacon Economics. “To put it in perspective, the Greek economy has a GDP of about $250 billion—slightly over one-fourth the size of the Los Angeles/Orange County economy.” Of the outstanding debt at play, only $50 billion is still held by the banking system in Europe, compared to $12 trillion in overall assets. “If the Greek government does push their nation out of the Euro zone, the tragedy there will only be added to,” said Thornberg. “But it is unlikely to create any real impacts elsewhere except for the largely pointless short term volatility it will create in the global financial markets.”

Greece is America’s 84th largest export destination, ranking between Ukraine and Ghana. In the latest three months, California’s exports to Greece totaled just $23,8 million.

Beacon Economics’ outlook for California’s merchandise export trade remains guarded. Although the state has an exceptionally diversified export trade, we expect exports to China (the state’s third largest export market) to continue to ebb. Exports to Canada (California’s second largest export destination) have been ebbing lately, largely as a result of unfavorable exchange rates. While we expect modest growth in the state’s exports to Europe, the biggest gains are likely to be seen in California’s exports to Mexico.
Graphics (click to expand)

2015 CALIFORNIA ALMOND FORECAST DOWN AS SET IS POOR

Screen Shot 2015-07-03 at 6.35.44 AMCalifornia’s 2015 almond production is forecast at 1.80 billion meat
pounds, down 3 percent from May’s subjective forecast and down 4
percent from last year’s crop. The forecast is based on 890 thousand
bearing acres. Production for the Nonpareil variety is forecast at 670
million meat pounds, down 6 percent from last year’s deliveries. The
Nonpareil variety represents 37 percent of California’s total almond
production.
The California almond bloom began in early February. The bloom was
one of the earliest almond blooms in memory. In general, the bloom
was fast and compact with Monterey and Fritz blooming earlier than
Nonpareils. In several instances, the lower two-thirds of trees
blossomed two weeks ahead of the top possibly indicating insufficient
chilling hours. Nonpareil set appears to be below previous year’s. High
temperatures in late June have raised the already high grower concerns
regarding water stress. Some growers have observed reduced
production from their wells as water levels have declined. In areas
where ground water is the primary source of water, some salt damage,
wilting of trees, and defoliation has been seen. With the heat, almond
hull split was moving fast. Harvest preparations were underway with ant
baits being applied to orchards. Harvest is expected to begin ten days
to two weeks ahead of normal.
The average nut set per tree is 5,874, down 12 percent from 2014. The
Nonpareil average nut set is 5,239, down 14 percent from last year. The
average kernel weight for all varieties sampled was 1.43 grams, down 1
percent from the 2014 average weight of 1.45. The Nonpareil average
kernel weight was 1.61, up slightly from last year. A total of 98.8 percent
of all nuts sized were sound.

Home Goods Store Coming To Visalia

July 2,2015

Popular retailer Home Goods will open a store in Visalia later this year in the Dicks Sporting Goods shopping center. The company will occupy the space formerly used by Staples on south Mooney Blvd.
The City of Visalia says they have received  a request for a variance for larger sign due to the fact the store is in the corner of the shopping center. The center is owned by developer Dave Paynter.

HomeGoods is a chain of home furnishing stores operated by TJX Companies and has more than 487 stores across the United States.
HomeGoods describes itself as a destination for off-price home fashions for every room including kitchen and gourmet cookware, accent furniture, lighting, rugs, bath and bedding, decorative accessories, seasonal merchandise, and much more.

Home Goods 2015-07-02 at 10.54.26 AM

Jobless Rate Falls in Tulare,Fresno Counties

June 19.2015-

Tulare County Jobless Rate Falls To 11 Percent

Screen shot 2012-07-05 at 7.20.30 AMThe unemployment rate in the Tulare County was 11.0 percent in May 2015, down from a revised 11.4 percent in April 2015, and below the year-ago estimate of 12.2 percent. This compares with an unadjusted unemployment rate of 6.2 percent for California and 5.3 percent for the nation during the same period.
Year over year farm jobs fell by 300 while nonfarm jobs were up by 3000.


Fresno Unemployment Rate Below Double Digits

The unemployment rate in the Fresno County was 9.8 percent in May 2015, down from a revised 10.1 percent in April 2015, and below the year-ago estimate of 11.0 percent. This is the first time since 2008  that the jobless rate in May was below a double digit number.
Between May 2014 and May 2015, total industry employment increased by 10,800 jobs (up 2.9 percent). Nonfarm employment rose by 10,500 jobs (up 3.4 percent), and despite the drought – farm employment gained 300 jobs (up 0.5 percent).
• Trade, transportation, and utilities reported the largest year-over increase of 3,200 jobs.
Wholesale trade added 1,500 jobs, retail trade grew by 1,100 jobs, and transportation,
warehousing, and utilities increased by 600 jobs.
• Professional and business services expanded by 2,500 jobs. Gains were in
administrative and support and waste services (up 2,400 jobs) and management of
companies and enterprises (up 100 jobs).
• Educational and health services posted an increase of 2,300 jobs. Healthcare and social
assistance added 2,200 jobs, and educational services rose by 100 jobs.
• Government recorded a gain of 1,200 jobs. Gains were in local government (up
600 jobs), state government (up 400 jobs), and federal government (up 200 jobs).
• Manufacturing posted an increase of 600 jobs, and financial activities grew by 500 jobs.

Around Tulare County: New Plaza Dr Hotel / Fruit Patch Update

June 17.2015-

Porterville-Based Group Buys Fruit Patch

Dinuba-based Fruit Patch has been acquired by a five-member investment group headed by Thomas Avinelis of Porterville’s AgriCare Inc. The company will utilize both the packing and cold storage facility  on Rd 140.

The parent company is based in Porterville with management activities in both California and Oregon.

The purchase amount wasn’t disclosed but is rumored to be in the $16 million range,far less that Fruit Patch was purchased for in 2006 by American Capital – said to $168 million at the time.

The name of the new entity is Legacy Packing and Cold Storage. “Our goal is to provide quality jobs and to maintain deep community ties,” Avinelis says. “We will create the premiere citrus and tree fruit custom packer in the industry.”

Legacy Packing will be entirely devoted to fresh-market fruit.He told the Packer newspaper this week that the operation was already up and going and they had hired former employees at Fruit Patch.

Legacy will provide packing service for growers of pomegranates persimmons and tree fruit as well as cold storage for table grapes. In colder months they will pack citrus.

Avinelis and his group have pioneered growing, packing and marketing of organic fruit including blueberries and have farms in both California and Oregon. One such partnership is Homegrown Organic Farms.

According to their website AgriCare, founded in 1990, has over 200 employees and manages 14,000+ acres of permanent crops in California & Oregon.

Avinelis grew up on a farm in Kerman and started his Tulare County farm operations after graduating from Cal Poly.

Screen Shot 2015-06-17 at 8.57.21 AM
Work To Begin On New Plaza Drive Hotel

Work is expected to begin on building a new 4-story Plaza Drive hotel in Visalia now that escrow has closed on 2.5 acres says broker Doug Burr. A Bakersfield developer, Raj Verma, will build a 95-room Marriott Residence Inn next to Fresno Pacific University. The property was purchased from the Bruno family. Building plans have been submitted to the city who already has approved a preliminary site plan. The project is part of the Plaza Business Park.

Biz Update: Fast Track To Pass / Ito Closes / June Rain Surprise

Screen Shot 2015-06-11 at 7.01.52 AMReedley Packer To Close

Reedley based Ito Packing will close in July laying off near 200 people. So says a state WARN notice and confirmed by the company. The company will be sold but they have not told us who the buyer is “ says an ITO employee. ITO has always specialized in tree fruit but has had financial issues for the past few years.

Fast Track Likely To Pass

The HILL newspaper says a vote Friday in the House will likely give President Obama a victory on fast-track trade authority.The measure that would  open markets is favored by California ag. The House GOP  is expected to vote overwhelmingly for the bill along with some Democrats.
According to the news source  “If the vote on Friday is successful, the trade bill would head to Obama’s desk, weeks before many thought possible. Fast-track powers would greatly enhance the president’s ability to conclude negotiations on a sweeping trade deal with Pacific Rim nations that is a key part of his economic and foreign policy agenda. They would prevent Congress from amending the trade deal, and stop the Senate from filibustering it.”

Giant Forest Gets 1.77 in of Rain/ Cuyama 2.5 in

Thunderstorms spawned by Hurricane Blanca continue to surprise with big numbers in a few spots  around California including Cuyama Valley where residents saw a flash flood from some 2.5in of rain. In the Tulare County mountains  Giant Forest got 1.77 inches.More storms in the central Sierra are expected today. Another storm is forming in the Baja region this week.

Gas Price Drop Approaches 30 Cents

California gas prices have been dropping in recent weeks,down nearly 30 cents from a high. The average price is  $3.56 says Gas Buddy.

Costco Is Organic Leader

June 10.2015

from Egg-Cite website

Jun 7, 2015
According to a June 2nd article in the Seattle Times by Angel Gonzalez, Costco has surpassed Whole Foods Market as the leader in sales of organic products.  Richard Galanti, CFO of the company noted that organic products generated $4 billion in the past fiscal year a 30 percent advance over the previous year.  Galanti noted that Costco organic business has doubled in two years. He commented “it’s still small, relative to total sales but growing faster and there is certainly more supply out there.”  Costco is obviously attracting a younger and more affluent clientele than competing club stores.

The organic sales value should be viewed against the total sales volume of $114 billion annually  generated by Costco. The Organic Trade Association estimates total organic-food sales at $36 billion which means that Costco has more than a 10 percent share the market.

Gonzalez considers that the entry of big box stores into organic will increase pressure on production, leading to increases in price.

Galanti noted that Costco was “pretty good at getting out there and working with suppliers both here and around the world to commit more too organic whether it’s raising eggs, ground beef or produce.”

California Exports Rebound

June 4, 2015 – The value of California’s merchandise export trade rebounded in April, edging up a nominal 2.1% from the same month last year, according to a Beacon Economics analysis of foreign trade data released this week by the U.S. Commerce Department.

The state’s exports of goods to foreign markets in April totaled $14.39 billion, up from the $14.09 billion recorded in April 2014. By way of comparison, total U.S. exports of goods saw a 4.2% decline in the same period, while exports from Texas shrank by a full 9.0%.

Screen shot 2012-07-05 at 7.20.30 AMCalifornia’s exports of manufactured goods rose 2.1% from $9.41 billion to $9.43 billion. However, exports of non-manufactured goods (chiefly agricultural produce and raw materials) slipped by 2.5%, from $1.81 billion in April 2014 to $1.76 billion in the latest numbers. Re-exports meanwhile surged by 11.3% from $2.87 billion to $3.20 billion.

Despite April’s positive news, California’s export trade so far this year is lagging last year’s pace by 2.8% due to fall-offs in foreign shipments in February and March.

A Closer Look At The Numbers

As always, Beacon Economics cautions against reading too much into month-to-month fluctuations in state export statistics, especially when focusing on specific commodities or destinations. Significant variations may occur as the result of unusual developments or exceptional one-off trades and may not be indicative of underlying trends. For that reason, Beacon Economics compares the latest three months for which data are available (i.e., February 2015 – April 2015) with the corresponding period one year earlier.

California’s merchandise exports during the February-April period totaled $41.92 billion, a nominal decline of 3.1% from the $43.26 billion recorded during the same period twelve months earlier. The state accounted for 11.0% of total U.S. merchandise exports in the latest three months.

California’s export trade is highly diversified. Normally, eleven major categories of goods have each accounted for at least $1 billion in exports in each three-month period. However, this February-April period saw that number fall to ten, as exports of Waste and Scrap fell just below the $1 billion threshold. Among the top ten categories, performance was variable with only four categories showing growth.
Topping the export list was Computer & Electronic Products, up 7.8% from $9.90 billion to $10.67 billion. Exports of Agricultural Products continued to recover from recent declines with an 11.0% increase from $3.22 billion to $3.57 billion. Non-Electrical Machinery exports gained 2.4% from $3.90 billion to $3.99 billion. Likewise, Electrical Equipment exports rose 4.5% from $1.68 billion to $1.76 billion.

On the downside, Transportation Equipment exports fell 16.5% from $4.89 billion to $4.08 billion. Exports of Miscellaneous Manufactured Commodities (a catchall category of merchandise ranging from medical equipment to sporting goods) were down 2.5% from $3.51 billion to $3.42 billion. Exports of Chemicals fell 2.8% from $3.48 billion to $3.38 billion. Food and Kindred Products exports continued to stagger, down 14.8% from $2.82 billion to $2.40 billion. Petroleum and Coal Products exports declined sharply, falling 24.8% from $1.96 billion to $1.47 billion. Exports of Fabricated Metal Products slipped by 12.2% from $1.20 billion to $1.06 billion.

Mexico continued to rank as California’s single largest export destination during the latest three-month period, with the value of exports rising 14.4% from $5.94 billion to $6.79 billion. Exports to Canada fell by 4.7% from $4.45 billion to $4.24 billion, while shipments to China tumbled by 9.8% from $3.93 billion to $3.54 billion. Exports to Japan remained unchanged at $3.07 billion. South Korea (up 8.6% from $2.19 billion to $2.38 billion) rounded out California’s ‘Top Five’ national export destinations in the February-April period.

Regionally, California’s exports to the Asia Pacific region (including Australia and New Zealand) dropped 3.6%, falling from $16.28 billion to $15.64 billion, a dip propelled largely by the fall-off in exports directly to China. California’s exports to the European Union dipped slightly, slipping 1.9% from $7.67 billion to $7.53 billion. California’s exports to Latin America and the Caribbean (excluding Mexico) were down by 16.6%, dropping from $2.89 billion to $2.41 billion. California’s exports to South Asia (chiefly India and Pakistan) were up by 33.1% from $1.02 billion to $1.34 billion. The state’s exports to Sub-Saharan Africa in the latest quarter amounted to just $194 million, down 16.50% from $233 million during the same period twelve months ago.

By mode of transportation, 46.2% of California’s $41.92 billion merchandise export trade in the last three months was shipped by air, with Los Angeles International and San Francisco International Airports accounting for the vast majority of the state’s airborne trade. Seaports handled 31.6% of the state’s export trade, while the remaining 22.2% traveled overland by truck or rail to Canada and Mexico.
While considerable attention has been focused in recent months on the economic impact of congestion at the state’s major seaports and the fall-out from a contentious longshore labor contract negotiation, it is worth noting that containerized shipments comprise only about one-fifth of the value of California’s merchandise export trade. On a dollar basis, the state’s airports play a considerably more critical role than its seaports in facilitating its merchandise export trade.

The Outlook

Growth in the United State tipped into negative territory in the first quarter of 2015 largely driven by trade—real exports are down while real imports are up. “What is interesting is that the nominal trade deficit through the first 4 months of the year is only 2% larger than the first 4 months of last year,” said Christopher Thornberg, Founding Partner of Beacon Economics. “This is largely due to the fact that while we are importing more, the relative price of imports is down a lot—and because of that, financially, the U.S. is no worse off. Part of this is due to the collapse in oil prices, part is due to the appreciation of the U.S. dollar which has made all imports cheaper to buy.”

But Thornberg says it is a mistake to blame the increase in the real trade deficit solely on the appreciation of the dollar. The rise of the dollar can be tracked largely to the announcement of the European Central Bank’s Quantitative Easing Program, which was designed to increase lending and reduce rates in the Euro Zone. The dollar’s appreciation against the euro has been the largest—up almost 12% over the last year. But the largest increase in the nominal trade deficit has not been with Europe – it has been with China, Korea, and Taiwan. And the U.S. dollar has actually depreciated modestly against the Chinese Yuan over the last year. In other words, the current trade situation has more to do with a clear slowdown in growth in the Chinese economy and the impact that is having across Asia.

Beacon Economics’ outlook for California’s merchandise export trade remains guarded. Water issues will only grow more and more contentious this year, but the drought’s impact on agricultural exports will vary by commodity. The ongoing progression of California agriculture toward high-value specialty crops will likely buoy the value of the state’s farm export trade, even if volumes decline. Less clear is the impact water-use restrictions will have on manufacturing and food processing operations that are heavy water users and which may be hard-pressed to invest in measures to slash water consumption.

Foreign trade generally is apt to be less than robust throughout the year. Mexico and Canada – the state’s two top export destinations – have recently cut their respective economic growth forecasts for 2015, while Japan expects to see its economy expand by less than 1% this year. Meanwhile, China’s economic growth rate is expected to continue ebbing. The official forecast is holding at 7% this year, but the actual rate is widely expected to be somewhat lower. On a more encouraging note, the European Union is showing signs of working its way out of its years-long malaise.

Also favorable, as Beacon Economics has observed previously, a significant portion of California’s export trade to Mexico are components shipped to assembly plants south of the border where they are incorporated into a wide array of goods that are then exported back to the United States. As a result, the state’s merchandise exports to its leading export market tends to mirror U.S. economic performance as much, if not more, than the economic performance of its closest neighbor.