Japanese consortium to propose Kawasaki Heavy bullet trains for high-speed line in California

from Japan Times

May 1,2015

Editors Notes: this article came out ahead of Mr Abe’s visit to California today where indeed he and the Governor talked high speed rail.

Screen Shot 2015-05-01 at 12.22.20 PMNEW YORK – A consortium of Japanese companies is planning to propose Kawasaki Heavy Industries Ltd.’s bullet train technology for use in a high-speed rail link in California, sources with knowledge about the plan said.

Prime Minister Shinzo Abe is expected to make a pitch for the technology on an official visit to the United States that begins Sunday, ahead of bidding likely to be held later this year, according to the sources.

The technology is based on Kawasaki’s efSET, short for environmentally-friendly super express train, and is designed to achieve an operational speed of 350 kph.

Eyeing competition from Germany’s Siemens AG and others, Kawasaki says efSET is adapted to stress energy conservation, ride comfort and safety, including fire resistance — qualities often demanded in bids for overseas rail projects.

The Japanese alliance including Kawasaki and East Japan Railway Co. (JR East) is hoping to outbid its Chinese rivals, who are known to offer competitive pricing, believing its train excels in performance on high-speed runs as well as in safety.

The consortium’s bid could become a test case to see whether the government’s infrastructure export initiative will meet expectations as a centerpiece of its strategy for reinvigorating the national economy.

Employing its expertise in shinkansen, Kawasaki started developing the concept design of the efSET in 2008, sporting a sleek aerodynamic head to cut air resistance.

The manufacturer says it incorporates key devices and tools employed by the shinkansen, which has built a reputation for reliability.

Made of aluminum alloy, its lightweight body helps to reduce energy consumption, an environmentally friendly feature that would appeal to eco-conscious California citizens, the sources said.

Kawasaki has built vehicles for the Tokaido and Sanyo Shinkansen lines as well as the Hokuriku Shinkansen Line, which just opened an extended sector between Nagano and Kanazawa in March. It has also built trains for Taiwan High Speed Rail Corp.

One of the selling points for the Japanese consortium will be the strong safety record of the shinkansen, the sources said. No passengers have died on the bullet train since its launch in 1964 in Japan.

As California is prone to earthquakes, the Japanese consortium is also planning to bid for traffic signals and relevant systems necessary to halt train operations when a quake occurs, the sources said.

The California High-Speed Rail Authority is initially soliciting initially 16 trains, each with a minimum of 450 seats, that can sustain speeds of over 350 kph. The authority is planning to place orders for up to 95 trains.

If the Japanese alliance wins, prototype models would first be manufactured at Kawasaki’s Hyogo factory in Kobe and commercial vehicles would be assembled in the United States, according to the sources.

The California high-speed rail project aims to link San Francisco and Los Angeles, the state’s two major metropolises, in less than 3 hours. It will also serve the high-tech Silicon Valley region, as well as state capital Sacramento.

The Japanese consortium will likely feel tremendous pressure from Chinese manufacturers if they have to compete on the pricing front alone for the California project, which is worth an estimated $68 billion.

Under Beijing’s “railway diplomacy” strategy, Chinese train builders have been increasing their presence in the United States. In October last year, China CNR Corp. won an order for subway vehicles in Boston, outdoing Japanese competitors.

But the record for China’s high-speed rail service was marred by a fatal accident — a 2011 collision in Zhejiang Province that the Chinese government said killed 40 people.

“No one was injured on shinkansen trains when the Great East Japan Earthquake struck in 2011,” an official from a company in the Japanese consortium said.

“We are confident that the Japanese consortium stands to gain if we can compete on quality, technological prowess and safety, not just pricing,” the official said.

On March 11, 2011, the magnitude 9 temblor derailed a bullet train in Tohoku that was on a trial run and was carrying no passengers.

A magnitude 6.8 earthquake in 2004 dislodged a Joetsu Shinkansen Line train with 154 passengers and crew onboard in Niigata Prefecture but no one was injured or killed.

The Japan Railway group companies, which operate a network of shinkansen services in the country, have since been introducing devices to reduce the derailment risk.

California Whipsawed By Weather Prospects

April 30,2015-

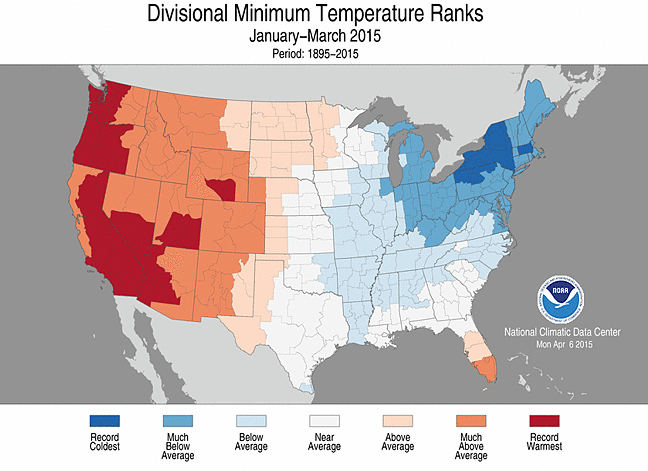
Most of California saw record temperatures during the first three months of 2015 says a recent NOAA report. The report appears to add fuel to the firestorm of pending doom in the Golden State suffering not just from out of control heat ,but zero snowpack, lack of coastal fog, dying forests, and a growing pest infestation just to name the more friendly fear factors.

Screen Shot 2015-04-27 at 3.37.10 PM
The record warmth extends into the western Pacific described as a pool of warm water sometimes blamed for impacting the storm track off the West Coast (see global map).

Screen Shot 2015-04-17 at 3.07.05 PM
A never ending ridge of high pressure this winter kept all but a few significant storms from entering our part of the world from January through April. Here are some details.

At the end of March a report concluded that “drought remained entrenched in the western United States, where mountain snowpack was record low for many locations in the Cascade and Sierra Nevada Mountains. Moderate to exceptional drought conditions were present across more than 98 percent of California, leading to unprecedented water restrictions in the state.”
Weather bloggerDan Swain pointed out that “Most of the precipitation that has fallen in NorCal this winter has occurred as the result of the two brief, warm, and intense storm sequences in early December and early February. In fact, in a few spots around the Bay Area, the vast majority of the precipitation so far this winter has occurred over the course of just 3-4 calendar days (!). Together, these data suggest a remarkable temporal concentration (intensification) of precipitation in California this winter.
There is a common cause of the extreme warmth, record-setting precipitation variability, and exceptionally low Sierra Nevada snowpack: the Ridiculously Resilient Ridge, Redux. This persistent feature near the West Coast has set up a little further east this year than in preceding winters, allowing the subtropical jet to make occasional incursions along its western flank. As this persistent ridge has wobbled around, conditions have remained very warm during both wet and dry spells. In addition, the Western ridge is forcing Pacific storm systems to take make a sharp poleward turn 1000-2000 miles west of California, advecting copious warm/moist subtropical air toward much higher latitudes in Alaska and British Columbia. Because the ridge is slightly further east this winter, California has been able to benefit very occasionally from this constant northward stream of moisture–meaning that what precipitation has occurred has been of the warm and wet variety.”

Next Flood?

If you can’t get drought off your mind, try floods. Here is a brief on that possibility that the state could be deluged by a 150 year flood!
“From drought to deluge, California and the Bay Area can expect increasingly dramatic weather swings as the effects of climate change become more pronounced and dangerous. Against that backdrop, the Bay Area Council Economic Institute today (April 20) released a new study estimating the Bay Area would suffer a minimum of $10 billion in economic damages from an extreme storm that many experts believe is overdue—an amount rivaling that of the 1989 Loma Prieta Earthquake.
The damage would be severe along the bay’s thousands of acres of waterfront land, where companies from Facebook to Google employ hundreds of thousands of workers, 355,000 residents have homes and key economic and civic infrastructure is located, including ports, airports, and water, energy, sewage and transportation facilities. The report relies on existing scientific models that envision an “atmospheric river” dumping the equivalent of 10 Mississippi Rivers on the region over 10 days, causing widespread flooding and disruption to road and air travel.
STORM DETAILS
– Approximately 150 year return period.
– Up to 10 days total rainfall, with 12 inches over 4 to 7 days.
– Elevated creek and river flows lasting over one week; peak flood flows last one day.
– HIgh tide in the Bay based on maximum observed tide which occurred in January 1983

Lets Not Forget El Nino!

Of course the promise of a vigorous El Nino weather pattern this  winter turned out to be El Busto. Forecasters thought El Nino would gain strength but it hovered in mild territory – just under 0.5 degrees warmer than average water temps and has only now headed into a full fledged El Nino at around 0.7 degrees increase.
The Cliff Mass Weather Blog notes that “.. during the last few months the situation has altered substantially with temperatures in the central and eastern tropical Pacific surging upwards.   NOAA and Australian forecasters are now saying we are in an official El Nino and it appears it will become moderate or strong this year.”

Of course ”we’ve heard this before ,adds Swain,noting that ” last year, in fact, there were very similar indications of a strong El Niño event in the works, and only a very modest, atypical event actually ended up taking place. The failure of most dynamical ocean-atmosphere models to capture this recent evolution means that it is probably wise to view these renewed ENSO forecasts with some modest skepticism, though it’s worth noting that 2015 has already featured a westerly wind burst even stronger than last year’s very impressive one, and that warm conditions have started to develop rather rapidly across the tropical East Pacific in recent weeks.”
On April 9, 2105 NOAA issued a updated El Nino statement saying “there is an approximately 70% chance that El Niño will continue through Northern Hemisphere summer 2015  and a greater than 60% chance it will last through autumn.”

Screen Shot 2015-04-27 at 3.24.52 PMSome models are predicting a strong El Nino – well above 1.5 degree C to near 2.0 going into years end when California could receive heavy rainfall. Unlike a weak El Nino like 2014/15 – a strong El Niño decreases the risk of a very dry year, and it increases the likelihood of a wet one,” says one forecaster.

The Oceanic Niño Index (ONI) for January-March 2015 is more than 1°C warmer than for the same period in 2014, meaning we are starting off from a warmer base state than last year.

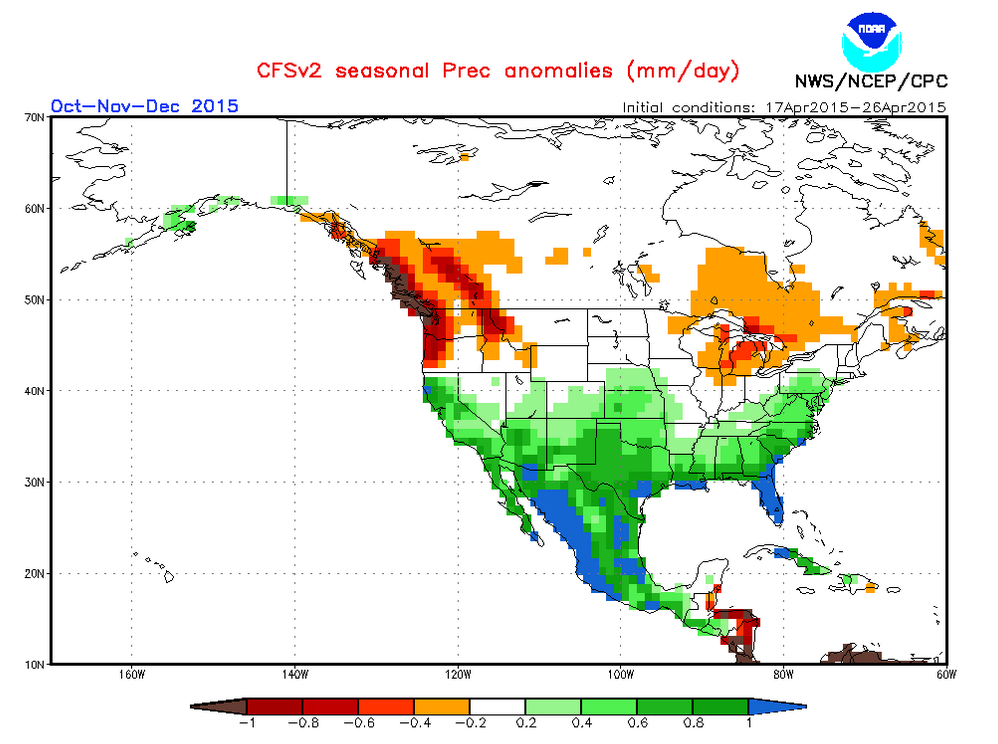
For now here is what NOAA is predicting this coming winter, still months away.

Our brains will be whipsawed some more.

A wet winter?
A wet winter?


Plans For Two New 400K Warehouses In Visalia Industrial Park

April 22,2015

The Heller family hears opportunity knocking at the Visalia Industrial Park. Adam Heller along with is father owned Heller Performance Polymers at 7227 Doe until it was sold in an employee buyout a few years ago. The Hellers retained 53 acres here. After selling off 13 acres with a building to their neighbors to the east – Hydrite Chemical – they still have 40 acres.

As of a few days ago that land is now vacant having demolished the old 65,000sf plastics plant that sat on it ( see picture).

Heller 2015-04-21 at 2.11.15 PM

The open land is divided by a rail spur and Adam Heller says “we like the fact we can build two large rail-served warehouses on the property  here in the Central Valley where there has been very little built during the past few years.”

Visalia broker Doug Burr say the Visalia Industrial park has only one 50,000sf warehouse available for lease right now.The plan now is to construct two new 400,000 sf warehouses to be built-to-suit for a tenant.

Need For More Rail Service

“We expect it to fill quickly” adds Burr, noting demand is high and supply virtually nonexistent – particularly for rail served property.

“There is none I know of in the Central Valley.” A number of industries, notably food, seek to have both the ability to ship and receive by truck but by rail.

Visalia officials have recognized the need for additional rail service to the industrial area and are working with TCAG on a plan to add more rail connections.

This week the city of Visalia are processing Heller’s plan for the two warehouses.

“We hope to have the building up within a year” says Adam Heller. At 800,000 square feet the buildings would be the largest constructed in the industrial park in a number for of years.

Fresno’s Diversified Development is working with the city to build 400,00sf of ‘spec’ space on American and Riggin.

The industrial park is big job generator employing about 5000 according to city mayor Steve Nelsen.

Speaking at a breakfast meeting of the Visalia EDC this week vice mayor Warren Gubler said “the discussions with TCAG regarding the potential for expanding rail service to our zoned industrial land would not have been occurring without the efforts of the VEDC.”

Limited Statewide Economic Impact of Drought Says Fed Report

April 14, 2015
Jason Sisney, Justin Garosi
Federal Reserve of SF

Over the last year, we often have been asked about how California’s severe drought will affect the economy and state government tax revenues. Our short answer is this: while the drought is affecting many Californians and communities in different ways, we currently do not expect the drought to have a significant effect on statewide economic activity or state government revenues. A recent Wall Street Journal survey reportedly showed that the vast majority of economists agree that the economic effects of the drought will either be “too small to show up” in economic data or be “small but measurable in the data.”
That being said, we acknowledge the drought as a risk factor for the state’s economy, especially if its effects worsen or are prolonged. We will continue to monitor data and other researchers’ analyses to try to understand how the drought is affecting California’s economy and state and local tax revenues. (The drought also will continue to result in added state spending, such as wildland firefighting costs, but that added spending is not the focus of this post.)
Why a Limited Statewide Economic Impact?
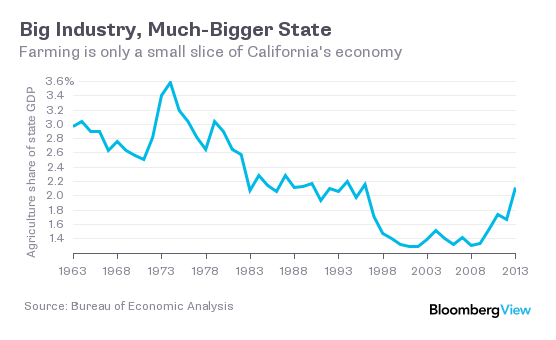
Agriculture Is Small Share of State’s Economy. As has been widely reported recently, a large portion of California’s available water is used by its farms. California is the leading farm state, and significant additional changes in agriculture’s use of water could affect that sector, potentially forcing farmers to fallow more fields or switch to different crops or livestock either temporarily or permanently. In some cases, such switches could be to lower-value crops or livestock, while in other instances, the switches could be to higher-value products. Local communities with economies heavily concentrated in particular aspects of agriculture could be heavily affected, and some communities already have been heavily affected.

Screen Shot 2015-04-15 at 11.37.26 AM

Nevertheless, agriculture directly generates only about 2 percent of the entire state’s gross domestic product (GDP). With agriculture-related businesses (such as food-related manufacturing) added, agriculture’s share of state GDP rises somewhat (to around 3 percent of GDP, a Bloomberg article recently estimated). Similarly, agriculture and related jobs combined probably make up between 3 percent and 4 percent of all jobs in the state. Even a substantial decline in agriculture’s share of the economy, such as occurred during and after the 1976-77 drought, probably would have only a limited impact on the overall state economy. Real California GDP, for example, rose even during 1976 and 1977.
Residential Water Changes Notable, But Not Likely a Major Drag on Economy. On April 1, the Governor directed state departments to implement statewide mandatory water reductions. Among the Governor’s directives were a 25 percent statewide decrease in cities and towns’ water usage, restrictions on water usage by golf courses and other large landscapes, and a prohibition on sprinkler usage in new homes unless water-efficient drip irrigation is used. These are noticeable changes, but they seem unlikely in and of themselves to result in a significant drag on the state’s economy. California homebuilders, for example, already are required to meet various water efficiency and other water requirements. The new requirements, if they are finalized and remain in place, seem likely to change landscaping and perhaps other aspects of residential and commercial construction in some communities. Still, homebuilding and other construction continues in the state, and there is no broad change in overall consumer spending or sentiment at this time resulting from the drought.
Drought Is An Economic Risk to Monitor

How Will California Agriculture Change? While agriculture makes up a relatively small portion of economic activity and jobs statewide, it is much more significant in communities in the Central Valley and some other parts of the state, many of which have higher unemployment and lower incomes than other parts of California. California’s position as a leading farm state has always been a key economic advantage. According to the California Department of Food and Agriculture, California exports internationally around one-fourth of the farm commodities it produces (as measured by the weight of those commodities). The recent strong growth of California international farm exports—valued at $18 billion in 2012—has been associated with growing production of high-value crops like almonds, which are a significant export to both Asia and Europe. California also ships many agricultural products to other U.S. states. International and interstate exports, including agricultural sales, are important drivers of California’s economic growth. If future changes in agricultural water usage (including, potentially, groundwater usage) result in less of this export activity, those changes may result in a drag on future economic growth and fewer jobs in various other sectors in communities with a significant agricultural presence. Any long-term changes in water use that significantly alter food prices also could be a concern for the broader economy.
How Will Water Changes Affect Homebuilding and Consumers? The changes ordered by the Governor in residential water rules will affect the economy. As with most economic changes, there will be economic “winners” as well as “losers” from such changes as businesses adapt to any changes in residential landscapes, water prices, and the like. For the overall state economy, it seems to us that the most important economic effects could be on homebuilding—already too slow to meet demand. If, hypothetically, the drought were to contribute to significant new restrictions on homebuilding and other construction, that could negatively affect construction employment, consumption, business expansion, and state and local revenues. Moreover, if the drought results in weakened consumer sentiment, that could negatively affect the economy and state and local revenues modestly—reducing, for example, consumer purchases of cars, appliances, etc.

Bank Lending Surged in California in 2014

April 15, 2015

The Federal Reserve Bank of San Francisco
California Bank Lending Growth Well Above the National Growth Rate.

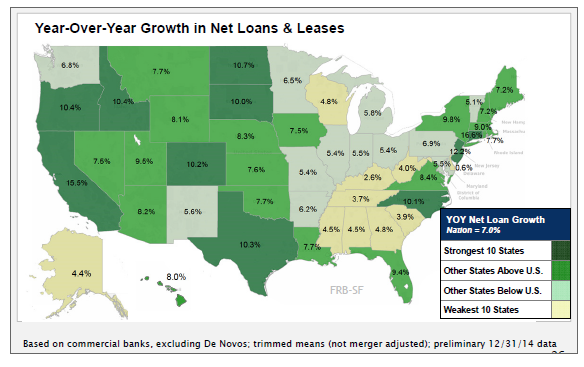
A highlight of this and other FRBSF reports has been the strong growth in lending by banks in California last year. As shown in the figure below, for 4Q2014, the year-over-year growth rate for such lending among California banks was 15.5%, which was well above the nation’s 7.0% growth rate. “While economic gains likely fueled most loan growth” in the region recently, the FRBSF indicated that “looser underwriting may have contributed as well,” even as bank asset quality improved, as discussed below. Bank credit is a critical aid to economic activity in residential building and commercial and industrial expansion, as well as consumer spending funded by credit cards, auto loans, and the like.

Screen Shot 2015-04-15 at 11.33.41 AM

4Q2014 California Annual Loan Growth Rate Led All States But Connecticut. The FRBSF map shown below indicate that the 15.5% year-over-year growth rate in net loans and leases at commercial banks in California for the fourth quarter of 2014 ranked second in the nation, behind Connecticut’s 16.6% growth rate.

As shown below, bank lending growth in western (that is, 12th District) states, especially California, was stronger than the nation’s overall 7.0% growth rate in 2014. California’s growth rate for lending neared pre-recession peaks, the FRBSF reported.

The recent, relatively strong growth of lending in western states is typical of a past trend, illustrated below in an FRBSF chart. The chart shows that bank lending in this part of the country has accelerated faster than in the rest of the U.S. during strong economic times since 2001. Conversely, following the 2009 economic downturn (precipitated by a collapse in mortgage-related credit), lending in the west contracted much more than in the rest of the country.

What Types of Loans Accounted for the Increase? The FRBSF reports that in the west, “commercial and industrial lines and certain real estate loan categories continued to lead” recent lending growth in dollar terms.

Hanford Expects $800,000 To Plan High Speed Rail Station

April 14,2015

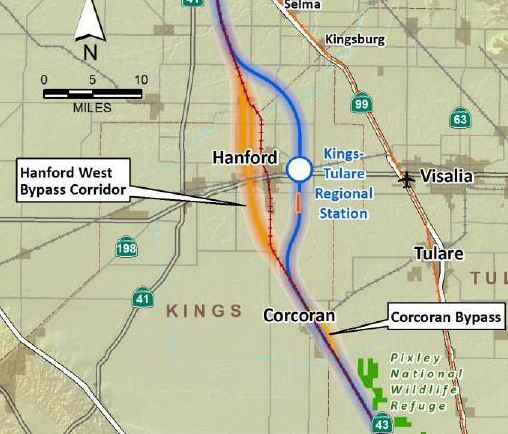
Hanford City Manager Darrel Pyle says the city will go out to hire a consultant to plan the high speed rail station on the east side of town.”We are expecting an $800,000 planning grant from  the High Speed Rail Authority  so we expect to publish a Request For Proposals(RFP) be the end of this month.”
Pyle says part of the planning effort will include a partnership with NAS Lemoore and the Tulare County Association of Governments (TCAG) to connect both the naval base and Tulare  County to the station with a possible light rail system.”
The 25 acre station will be located astride the Cross Valley Rail near 198 making a direct rail connection east-west possible.
With the expansion of the  naval base underway the US Defense Department is said to have a  strong interest in local transportation project.
Regarding Tulare County,TCAG deputy director Ben Giuliani confirms that  agency’s participation.
Visalia transit manager Monty Cox says “We will absolutely have a connection to the Hanford station but it is more likely to be a bus connection than light rail.” The city has its Sequoia Shuttle program that could wisk HS rail visitors to Visalia hotels and up to Sequoia. Over 30% of Sequoia visitors are from overseas.

Screen Shot 2015-04-14 at 11.16.24 AM

RePlanet To Hire 100 In Visalia

April 13,2015

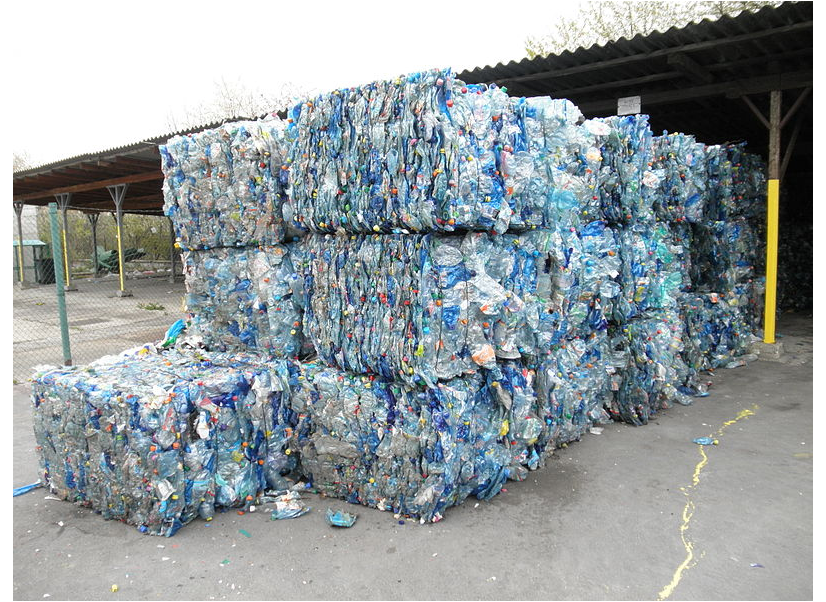
The state’s largest recycler, rePlanet, based in Corona California, has hundreds of retail collection locations around the state. Now the company will use those tons of  plastic PET bottles to make those familiar clamshell containers for the ag industry. They will do this in Visalia having just started production this month at their new location on on Goshen Ave.

The company leased the former Stanley Bostitch staple plant at 6941 W Goshen Ave in January that had sat empty for some time.

PET 2015-04-13 at 11.03.46 AM Screen Shot 2015-04-13 at 11.03.46 AM

“We are up to 25 employees this month and should be around 100 in 7 months” says plant manager John Collins. Collins is a local who worked for Reynolds in Visalia and Peninsula Packaging in Exeter.

“ We picked Visalia not just because of the location near farmers in the San Joaquin Valley but because of the work ethic here.” He adds that the City of Visalia  has been cooperative with the retooling of the plant.

The new manufacturing plant is called RePlanet Packaging, a division of RePlanet Recycling, a $200 million company. “We’ve got over 500 locations where people drop off  their recyclables ” says Collins. Now those recyclables will get a second chance or more.

The end product, clear clamshells have taken off in the fruit distribution business where the protect fragile fruit and veggies in the shipping and display of produce. You can spot them in the supermarket like those that used to sell blueberries.The clamshells are recyclable and are typically cleaned and reused.

PET bottles enjoy a good recycling record in California looking to help stop water bottle waste on our roadsides and sea shores as well as save space in our landfills.

While the state seeks a 75% recycling goal for all products, the California Redemption Value (CRV) program provides cash incentives for recycling helping to push some 86 percent of all beverage containers to be successfully recycled in 2013, according to CalRecycle.

Still,in 2013, 30.2 million tons of material were landfilled and 0.86 tons of waste were incinerated at the three transformation facilities in California.

The state 2013 CalRecycle report says “ Californians generate solid waste at their homes and workplaces every day. Currently, about half of this material is source-reduced, recycled, or composted, and half is disposed at landfills (buried), disposed at transformation facilities (burned to produce energy), or handled in another disposal-related activity. While almost all of this material could and should be source-reduced, recycled, or composted, it is likely there will always be some remaining material that needs to be disposed or managed by alternative methods. In the 25 years since people became concerned about landfill capacity in the late 1980s, the management of solid waste has changed tremendously, with much more emphasis on saving resources and reducing disposal. The solid waste collection, handling, and disposal infrastructure has also evolved. From initial generation to final disposition, California still has about 37 million tons of material that goes to disposal, or activities closely related to disposal, each year. That is nearly 1 ton (2,000 pounds) of solid waste for every resident every year.”

RePlanet retail drop off points in Visalia are at 1300 W Walnut Ave
and 737 S. Lovers Lane.

UCLA Forecast: Steady Gains For California

March 12,2015 –

Screen shot 2012-06-15 at 12.12.22 PMThe UCLA Anderson Forecast for March calls for continued steady gains in employment through 2017 in California. “The increase in U.S. growth rates from construction, automobiles, and business investment, as well as higher consumer demand, will continue to fuel our local economy,” says Senior Economist Jerry Nickelsburg, author of the California forecast. Nickelsburg says that the result will be a steady decrease in the state’s unemployment rate over the next three years. He expects the state’s unemployment rate to be insignificantly different from the U.S. rate, at 5.1% by the end of 2017.

The estimate for the 2015 total employment growth is 2.4%, and 2.2% for 2016 and 1.5% for 2017. Payrolls will grow at about the same rate during the next three years. Real personal income growth is estimated to be 4.2% in 2015 and forecast to be 4.6% and 3.7% in 2016 and 2017, respectively. The unemployment rate will hover around 6.5% through the balance of 2015.

California Exports Outpace Nation Despite Port Labor Dispute

Ag Products Hard Hit

Screen shot 2012-06-15 at 12.12.22 PMMarch 9, 2015 – Despite labor strife that reportedly stymied trade through West Coast seaports in January, California’s export trade actually fared better than the nation as a whole that month, according to Beacon Economics’ analysis of foreign trade data newly released by the U.S. Commerce Department.

The state’s merchandise export trade in January totaled $12.67 billion. While that represented a nominal 1.6 % decline from the $12.87 billion recorded in January 2014, overall U.S. merchandise exports fell 4.7% over the same period. Exports from Texas and New York plummeted by 15.4% and 13.0%, respectively.

Exports of manufactured goods from California saw a 2.2% drop from $8.26 billion to $8.07 billion. Exports of non-manufactured goods (chiefly agricultural produce and raw materials) took a much larger tumble, falling 17.9% from $1.69 billion in January 2014 to $1.39 billion. Re-exports meanwhile rose by 9.7% from $2.93 billion to $3.21 billion.

Beacon Economics attributs January’s decline in exports to a dollar which had been growing steadily stronger since last spring, economic slowdowns throughout much of the world, and logistical bottlenecks at the state’s major seaports, which appeared to have had a deleterious impact on farm exports.

The months-long dispute over a new longshore contract aggravated already congested conditions at West Coast seaports. While the media devoted considerable attention to the plight of importers and exporters whose maritime shipments were being delayed or thwarted, scarcely any news coverage mentioned that only about 20.1% of California’s $174.1 billion export trade last year was transported in the steel shipping containers that were the focus of so much concern. If anything, California exporters are more than twice as dependent on the state’s airports, which handled 44.1% of California’s export trade last year. The balance was overland trade with Canada and Mexico.

The broad outlook for exports is a mix of both good and bad news. “The global economy is starting to look better, which is good for export demand,” said Beacon Economics’ Founding Partner Christopher Thornberg. “But at the same time, the bifurcated global recovery has caused the U.S. dollar to appreciate sharply, which will start to weigh on purchases in the next few months.”

A Closer Look At The Numbers

As always, Beacon Economics cautions against reading too much into month-to-month fluctuations in state export statistics, especially when focusing on specific commodities or destinations. Significant variations may occur as the result of unusual developments or exceptional one-off trades and may not be indicative of underlying trends. For that reason, Beacon Economics compares the latest three months for which data are available (i.e., November 2014-January 2015) with the corresponding period one year earlier.

California’s merchandise exports during the latest three-month period totaled $42.28 billion, a nominal decline of 0.8% from the $42.62 billion recorded during the same period twelve months earlier. The state accounted for 10.8% of total U.S. merchandise exports over the latest three months.

California’s export trade is highly diversified. Normally, eleven different major categories of goods have each accounted for at least $1 billion in exports during recent three-month periods. However, the November-January period saw that number fall to nine, as exports of Fabricated Metal Products and Waste and Scrap fell below the billion dollar threshold.

Among the remaining categories, performance was variable, with only five categories showing growth.

Topping the export list in latest three-month period was Computer & Electronic products (up 1.7% from $10.98 billion to $11.17 billion). Transportation Equipment also increased (up 3.2% from $4.40 billion to $4.54 billion). Also showing a gain were Non-Electrical Machinery products, up 0.5% from $3.70 billion to $3.72 billion, and Miscellaneous Manufactured Commodities (a catchall category of merchandise ranging from medical equipment to sporting goods), up 5.0% from $3.00 billion to $3.16 billion. Electrical Equipment exports also rose briskly from $1.05 billion to $1.67 billion, a jump of 23.0%.

Losses were especially sharp in Agricultural Products (down 12.0% from $4.09 billion to $3.60 billion) and Food and Kindred Products (down 14.1% from $2.69 billion to $2.25 billion).

Exports of Chemicals were off 0.2% from $3.30 billion to $3.29 billion. Petroleum and Coal Products exports declined by 1.4% from $2.16 billion to $2.13 billion. Exports of Scrap and Waste products plummeted 19.8% from $1.22 billion to $0.97 billion, while exports of Fabricated Metal products dropped 5.6% from $1.04 billion to $0.99 billion.

Mexico continued to rank as California’s single largest export destination during the latest three-month period, with the value of exports increasing by 9.9% from $5.87 billion to $6.45 billion. Exports to Canada fell 8.2% from $4.89 billion to $4.49 billion, while shipments to China tumbled by 22.4% from $4.39 billion to $3.45 billion. Japan (down 5.1% % from $3.12 billion to $2.96 billion) and South Korea (up 6.34% from $2.24 billion to $2.37 billion) rounded out California’s ‘Top Five’ export destinations over the last three-month period.

Regionally, California’s exports to the Asia Pacific region (including Australia and New Zealand) dropped 4.0% from $16.72 billion to $16.06 billion, a dip propelled largely by a fall-off in exports directly to China. Remarkably, considering the ongoing economic travails of the European Union, California’s exports to the EU were only off by 1.4%, slipping from $7.10 billion to $7.00 billion. California exports to Latin America and the Caribbean (excluding Mexico) fell by 11.4% from $2.92 billion to $2.59 billion. The state’s exports to Sub-Saharan Africa amounted to just $158.6 million, down 19.8% from $197.8 million during the same period twelve months ago.

By mode of transportation, 44.8% of California’s $42.28 billion merchandise export trade in the last three months was shipped by air, with Los Angeles International and San Francisco International Airports accounting for the vast majority of the state’s airborne trade. Seaports handled 31.7% of the state’s merchandise export trade, while the remaining 23.5% traveled overland by truck or rail to Canada and Mexico.

California Storms Fade Thru Mid-Month

March 6,2015

A dry January  and February is turning into a dry March through mid-month suggest  California forecast models. Only the extreme north of the state  should get a little precipitation as the high pressure ridge continues to shunt storms knocking on the door to the north.

A low is coming in March 11-12 but only sprinkles are expected for much of the state if that.
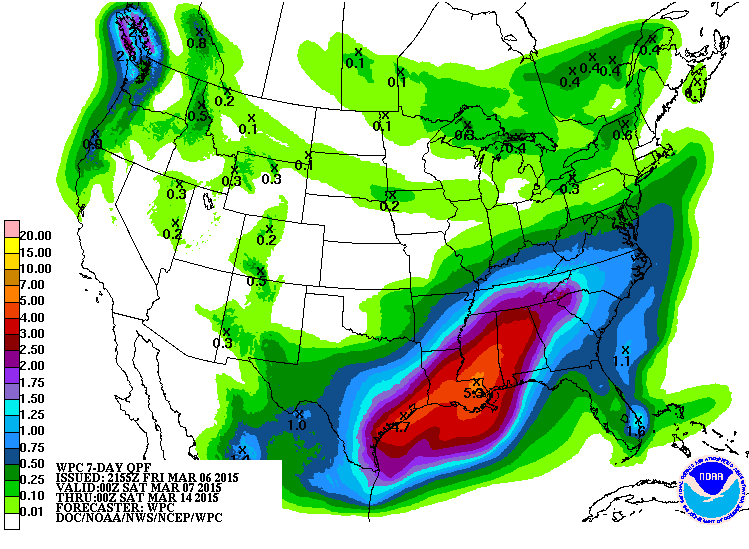
Here is the precip  forecast totals expected by NOAA  for the next 7 days, ouch!

Screen Shot 2015-03-06 at 4.44.35 PM

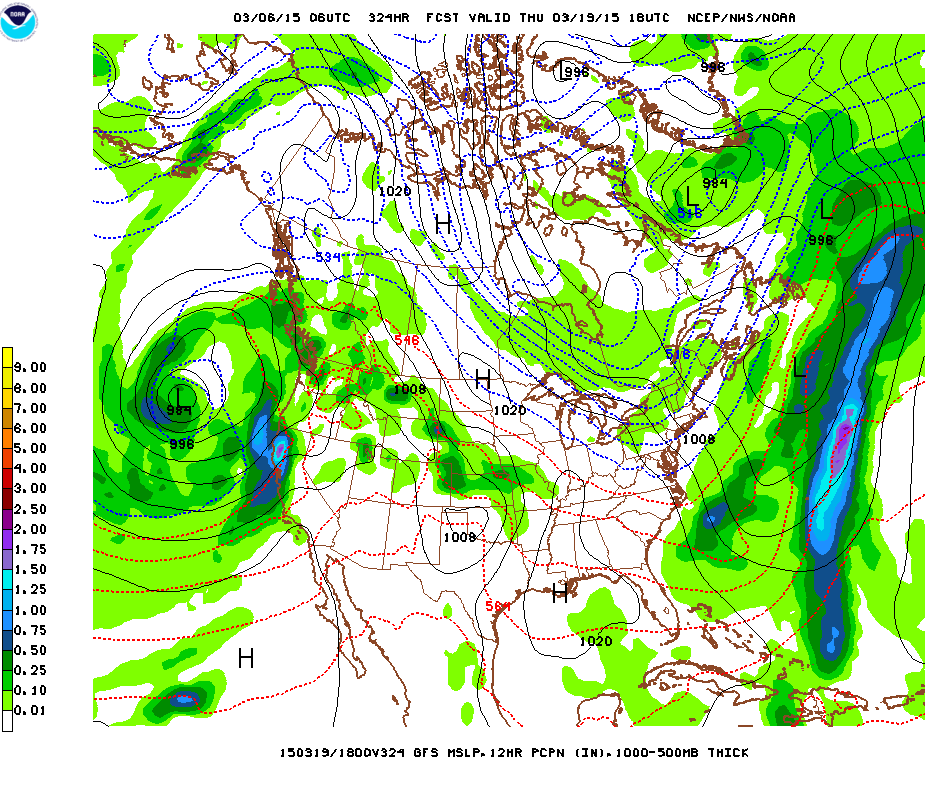
Not to leave you with absolutely no hope – here is the longer range forecast for the week of March 16 thru 21 where some GFS models show a parade of wet events coming into the state starting March 17 for at least 4 to 5 days. That far out the pattern could easily change.


Screen Shot 2015-03-06 at 4.41.26 PM