
August 8,2014
Groundwater is low in both San Luis Obispo County and Tulare County – two areas we focus on as part of the Sierra2thesea website. Note the dark red in these two areas in Middle California.
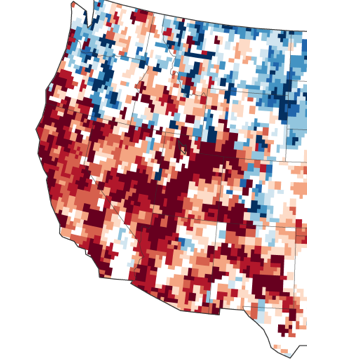 The map above combines data from the satellites of the Gravity Recovery and Climate Experiment (GRACE) with other satellite and ground-based measurements to model the relative amount of water stored in underground aquifers in the continental United States. The wetness, or water content, is a depiction of the amount of groundwater on July 7, 2014, compared to the average from 1948 to 2009. Areas shown in blue have more abundant groundwater for this time of year than comparable weeks over the long-term, while shades of red depict deficits compared to this time of year.
The maps are an experimental product used by the U.S. Drought Monitor and supported by NASA’s Goddard Space Flight Center. The measurements are derived from observations of small changes in Earth’s mass and its gravity field—features that are affected by the movement and storage of water and ice around the planet.