Commodity price snapshot shows disinflation
-May 1,2023-
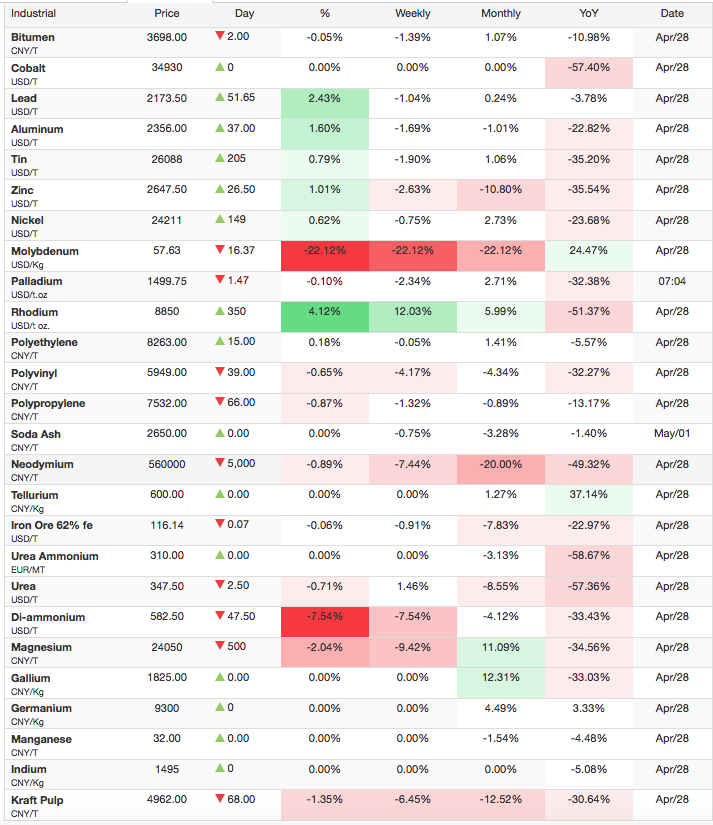
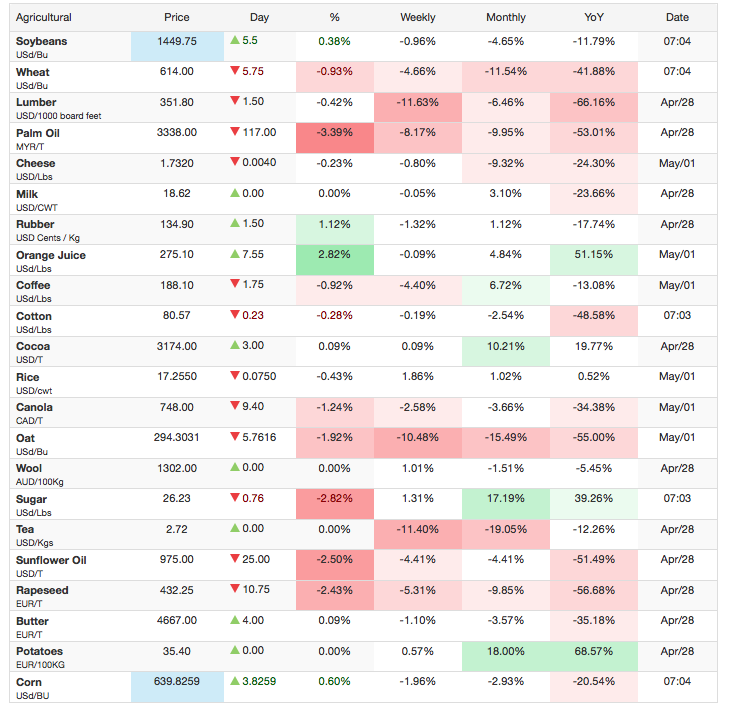
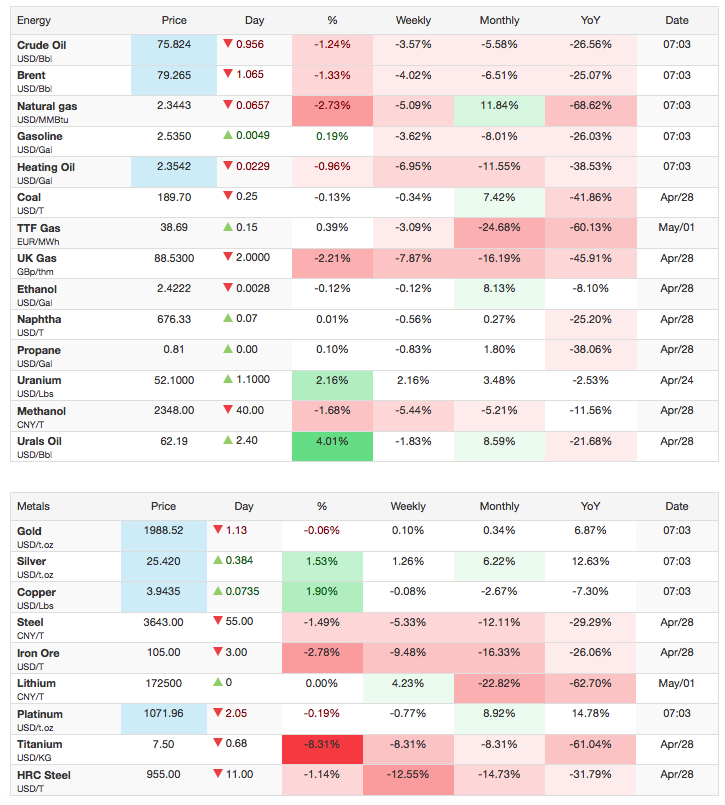
Take a quick look at these charts below and notice the red in year-over- year commodity prices in general.Charts are as of May 1, 2023 from Trading Economics website.
Most of the the key commodities, from soup to nuts, lumber to nickel – are ingredients used to make things – reflecting a decline in price from a year ago – some dropping 50% or more.
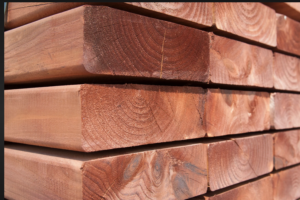 OK, orange juice and potatoes are costing you more. Don’t care much for urea? You probably do care about the price of food – grown with fertilizer made from urea. How about lumber – a commodity that a year ago cost $1500 for a thousand board feet – now down to $340.
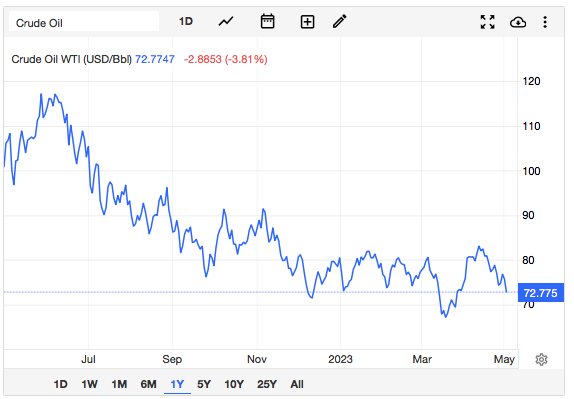
If there is one commodity we all worry about-it’s oil.Here is the latest chart for that vital resource: