
-March 9,2020-
Republican strength in mid-state slips
 From Santa Barbara and San Luis Obispo on the coast to Fresno, Kings and Tulare counties in the sun-baked interior of middle California, the trend is not the GOP’s friend. Once a Republican stronghold – political sentiment is heading in other directions registration statistics show.
While the winner of this tug of war are the Democrats in some counties – the clear victor in all of them including the state itself – No Party.
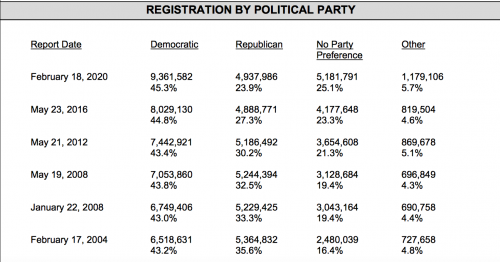
How about this for proof? Measured each primary season Republican registration statewide has dropped from 35% of total voters in 2004 to 24% this February while No Party Preference has risen from 16% in 2004 to 25% this year – higher now than GOP numbers statewide for the first time.
The percentage of Democrats has risen somewhat over the same time even though by the numbers – it looks more dramatic. Consider the GOP sported 5.6 million members in California in 2004 vs 6.5 million Democrats. Today the comparison is 4.9 million GOP voters vs 9.6 million Democrats. Meanwhile there are now 5.2 million No Party voters. That puts the ratio of reliable GOP voters in California today at just one in four ( see chart).
A look at historical figures show California tuned blue for good once the Great Depression hit in the 30s . But for much of middle California – the journey was more mixed.
Blue trend in some mid-state counties
San Luis Obispo County has been painted red forever with a 44% GOP edge vs the Democrats 37% – 20 years ago. Even in 2018, the percentage of GOP vs Democrat voters favored Republicans – 36.4% GOP vs 34.9. However by this year’s primary there was a switch in this horse race – 36.3% Democrats to 34.9% GOP. By the numbers, SLO registration shows 64,376 (D) vs 61,669 GOP voters -just under a 3000 vote edge.
Over the past 20 years SLO County has turned blue adding almost 16,000 (D) while Republicans have inched up by just 4000.
Shrinking GOP
Santa Barbara County has turned ‘blue-r’ over the years with 85,000 D vs 76,000 R and 30,000 No Party as of 2000. That compares to 102,000 D, 57,000 R and 55,000 No Party – this year.
That is an additional 17,000 Democrats, 19,000 fewer Republicans and 25,000 more No Party.
Not so blue
In Central California’s Tulare County where GOP Congressman Devin Nunes holds sway, the trend is mixed. The GOP by percent is in decline but still in control in this ag oriented county.
Today GOP registration here stands at 38.3% vs 32.3% Democrats. But in 2012, GOP voters were almost 45% while Democrats stood at 33.5%.
In 2000 it was more even with 52,000 GOP voters to 47,500 Democrats. That year No Party voters were 13,300.
So what is the count in Tulare County today?
As of Feb 2020 Tulare County had 70,262 GOP voters, 59,230 Democrats and almost 42,000 No Party. Again the big winner – No Party adding almost 30,000 voters over the 20-year period vs an additional 18,000 GOP and 12,000 more Democrats.
Fresno: big gains for No Party
In nearby Fresno County, Democrats did better. Figures show in 2000 there were 139,000 Democrats and 129,000 Republicans. In 2018 the numbers were 170,000 (D) and 151,000(R). As of February 2020 the numbers were 183,000(D) vs 154,000(R).
So since the year 2000 there are 44,000 additional Democrats vs 25,000 more GOP.
No Party voters in Fresno County number 106,000 this year -25.5% of the total vs 183,000 Demos and 154,00 Republicans. In the year 2000 Fresno County had just 31,000 No Party voters.
So in Fresno County, No Party voters since 2000 have gained by 75,000 – a bigger number than the GOP and Demos added combined!
In conservative Kings County the GOP has seen their percent numbers dwindling even though Democrat registration numbers are about the the same as they were 20 years ago. In 2020 39.8% said they were GOP vs 33% Democrat. In the primary of 2018, some 42% registered as GOP and 33% Democrat.
In 2000 the Kings County numbers were about even at 18,000 voters each.That year there were 4,500 No Party. By 2020, No Party numbers were 12,000 with 22,500 GOP and 18,500 Democrats.
Kings County GOP Registration
2012 – 45%
2018 – 42.2%
2020 – 39.8%
SLO County Dems vs GOP
2012 Dems 34% GOP 40%
2018 Dems 34.9% GOP 36.4%
2020 Dems 36.3% GOP 34.9%
California- Dems vs GOP
1930 – 500 k vs 1.6 mil
1934- 1.5 mil vs 1.4 mil
1950 2.8 mil vs 1.8 mil
1980- 5.8 mil vs 3.7 mil
2000- 6.7mil vs 5.1 mil
2020- 9.4 mil vs 4.9 mil