
-April 5,2023-
California’s merchandise export trade contracted in February (latest available numbers) from one year earlier, while its share of the nation’s merchandise export trade fell to an all-time low, according to a Beacon Economics’ analysis of U.S. trade statistics released this morning by the Foreign Trade Division of the U.S. Census Bureau.
The second month of the year saw California businesses export goods with a nominal value of $13.447 billion. That was down 8.0% from the $14.623 billion the state exported one year earlier.
 Shipments abroad of manufactured goods declined by 6.8% to $8.509 billion from $9.127 billion the previous February. Exports of agricultural products and raw materials dropped by 14.0% to $1.708 billion from $1.985 billion. Re-exports slipped by 8.0% to $3.230 billion from $3.511 billion.
“Storm-battered February presented some unique challenges to California’s exporters, many of them logistical in nature,” said Jock O’Connell, Beacon Economics’ International Trade Adviser.“ Apart from flooded farmlands and road closures, a fall-off in U.S. demand for imports led shipping lines to reduce service to West Coast ports, resulting in fewer ships available to carry exported goods.”
California’s share of the $158.942 billion in U.S. merchandise exports in February was 8.5%, down from a 9.7% share in February 2022. Back in pre-pandemic February 2019, California accounted for 11.0% of the nation’s merchandise exports.
LEADING EXPORT COMMODITIES
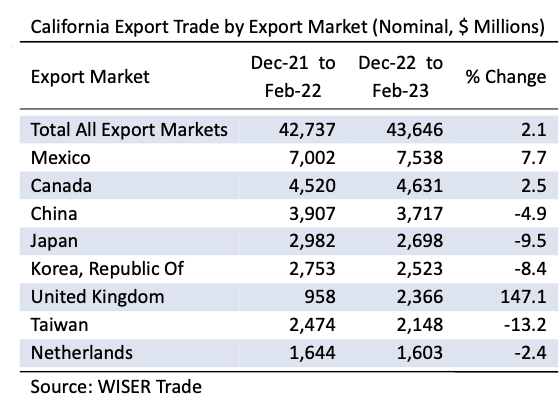
California’s merchandise exports during the past three months totaled a nominal $43.646 billion, a 2.1% gain over the $42.737 billion exported in the same months one year earlier. Of the eleven commodity groups with exports in excess of $1 billion in the latest three-month period, only five registered nominal year-over-year gains.
On the upside, Chemical exports (including pesticides and fertilizers; pharmaceutical products; paints and adhesives; soap and cleaning products; and raw plastics, resins, and rubber) jumped by 21.3% to $5.319 billion from $4.384 billion.
Exports of Transportation Equipment (automobiles, trucks, trains, boats, airplanes, rockets, and their parts) rose by 10.1% to $3.970 billion from $3.606 billion. Exports of Electrical Equipment and Appliances rose 6.4% to $1.968 billion from $1.850 billion.
Petroleum and Coal exports soared by 47.3% to $1.716 billion from $1.165 million one year earlier. Exports of Fabricated Metal Products increased by 9.1% to $1.218 billion from $1.116 billion.
On the downside, exports of Computer & Electronic Products (computers and peripherals; communication, audio, and video equipment; navigational controls; and electro-medical instruments) dipped by 2.4% to $9.775 billion from $10.020 billion.
Exports of Non-Electrical Machinery (machinery for industrial, agricultural and construction uses as well as ventilation, heating, and air conditioning equipment) declined by 6.6% to $4.570 billion from $4.891 billion.
Agricultural exports slumped by 4.1% to $3.100 billion from $3.232 billion. Shipments of Miscellaneous Manufactured Commodities (a catchall category of merchandise ranging from medical equipment to sporting goods) fell by 9.1% to $3.014 billion from $3.315 billion.
Shipments abroad of Food & Kindred products slipped by 4.8% to $2.601 billion from $2.732 billion. Foreign shipments of Waste & Scrap materials dove by 15.3% to $1.071 billion from $1.264 billion.